Wyckoff Method Trading Guide: Master Smart Money Moves
Wyckoff Method identifies market phases (accumulation, markup, distribution, markdown) through price action and volume analysis to trade in alignment with institutional operators.

Daniel Harrington
Senior Trading Analyst · MT5 Specialist
☕ 12 min read
Settings — Wyckoff
| Category | custom |
| Default Period | null |
| Best Timeframes | H1, H4, D1 |
Here's a mind-bending fact: over 90% of retail traders lose money, yet one 100-year-old method consistently identifies where the winning 10% place their trades. The Wyckoff Method isn't just another indicator – it's a complete framework for reading market psychology that reveals how smart money (banks, hedge funds, institutions) accumulate and distribute positions. Developed by Richard Wyckoff in the 1930s, this approach treats markets like a poker game where you can actually see the other players' cards. Instead of relying on lagging indicators, you'll learn to spot the footprints of big money before they make their major moves, turning you from prey into predator in the forex jungle.
Key Takeaways
- Richard Wyckoff wasn't your typical Wall Street analyst. Starting as a stock runner at age 15, he became one of the most...
- Understanding Wyckoff's four phases is like learning to read market DNA. Each phase has distinct characteristics that re...
- Volume Spread Analysis (VSA) is the Wyckoff Method's secret weapon – it's like having X-ray vision into market intention...
1Richard Wyckoff's Wall Street Revolution
Richard Wyckoff wasn't your typical Wall Street analyst. Starting as a stock runner at age 15, he became one of the most successful traders of his era by asking one simple question: "Who's really moving these markets?" His answer revolutionized trading forever.
Wyckoff discovered that markets move in predictable cycles controlled by what he called the "Composite Man" – a fictional character representing all the large operators (what we now call smart money or institutional traders). This Composite Man accumulates positions when prices are low, marks up prices to distribute at higher levels, then drives prices down to accumulate again.
The genius of Wyckoff's approach lies in its three fundamental laws:
Law of Supply and Demand: Price moves based on which force is stronger. When demand exceeds supply, prices rise. When supply exceeds demand, prices fall. Simple, but Wyckoff taught traders how to actually see this happening in real-time.
Law of Cause and Effect: Every significant price movement has a cause (accumulation or distribution phase). The length and intensity of this cause determines the extent of the resulting effect (price movement).
Law of Effort vs. Result: The effort (volume) should align with the result (price movement). When they don't match, it signals potential reversals.
In modern forex trading, these laws translate perfectly. When EUR/USD consolidates in a tight range for weeks with increasing volume, that's your Composite Man (major banks) quietly accumulating positions. The breakout that follows isn't random – it's the inevitable result of this accumulation phase.
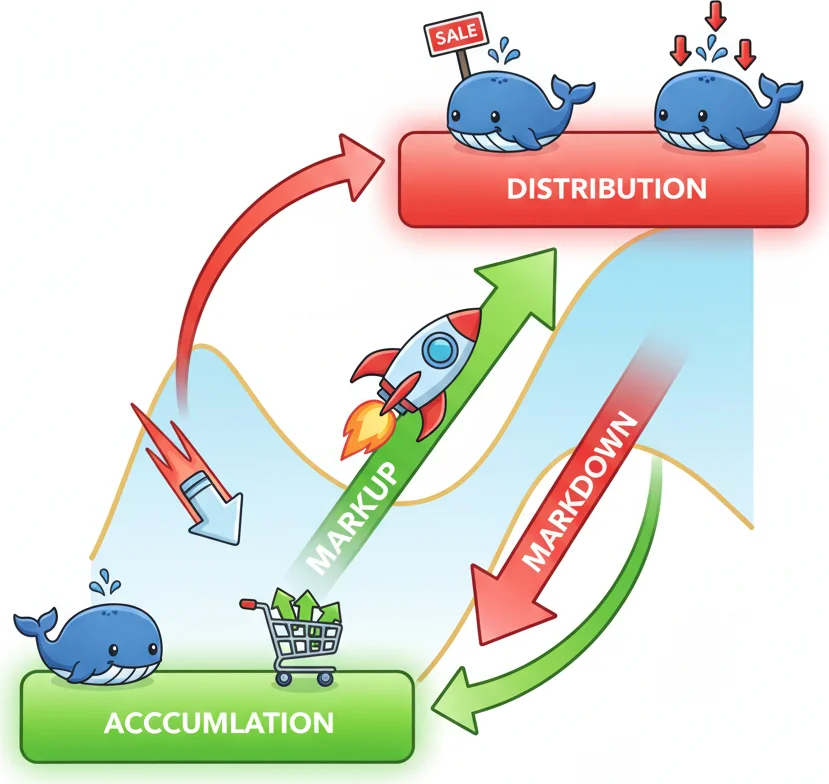
Wyckoff identified four distinct market phases that repeat endlessly: Accumulation (smart money buying), Markup (trending upward), Distribution (smart money selling), and Markdown (trending downward). Unlike traditional technical analysis that focuses on past price action, the Wyckoff Method helps you identify which phase you're currently in and what's likely to happen next.
What makes this approach particularly powerful in today's forex markets is that the same institutional behavior Wyckoff observed in 1930s stocks occurs daily in currency pairs. Central banks, commercial banks, and hedge funds still follow these patterns – they just do it with trillions of dollars across global markets instead of millions in individual stocks.
2Decoding the Four Market Phases
Understanding Wyckoff's four phases is like learning to read market DNA. Each phase has distinct characteristics that reveal what smart money is doing behind the scenes.
Phase A: Accumulation - The Smart Money Shopping Spree
Accumulation begins when a downtrend loses steam. You'll spot this when GBP/USD, for example, stops making new lows despite continued selling pressure. Key signs include:
- Selling Climax (SC): Massive volume spike with wide spread down bars, followed by automatic rally
- Secondary Test (ST): Price retests the low on reduced volume, often holding above the previous low
- Spring: A false breakdown below support that quickly reverses, trapping weak hands
During accumulation, institutional traders disguise their buying by letting price drift sideways or even dip lower while they gradually build positions. The untrained eye sees boring consolidation, but you'll recognize methodical accumulation.
Phase B: Cause Building - The Preparation Stage
This is where patience separates profitable traders from frustrated ones. Phase B can last weeks or months as smart money continues accumulating while testing supply and demand levels. Price oscillates between established support and resistance, creating the "cause" for the eventual markup.
On USD/JPY daily charts, you might see 200-300 pip ranges that persist for months. Volume analysis becomes crucial here – genuine accumulation shows steady volume on dips and lighter volume on rallies.
Phase C: The Spring and Jump Across the Creek
Phase C delivers the final shake-out before markup begins. The "Spring" (or "Upthrust" in distribution) is Wyckoff's most powerful signal. When EUR/USD breaks below established support on high volume but immediately reverses and closes back inside the range, you're witnessing smart money's final accumulation push while stopping out weak longs.
The "Jump Across the Creek" follows – a decisive break above resistance on expanding volume that signals Phase D markup is beginning.
Phase D: Markup/Markdown - Following the Smart Money Trail
This is where patient Wyckoff traders get paid. Price trends strongly in the direction of the previous accumulation or distribution. Your job isn't to pick tops or bottoms but to ride the institutional wave.
| Phase | Key Characteristics | Volume Pattern | Trading Action |
|---|---|---|---|
| Accumulation (A) | Range-bound, failed breakdowns | High on declines | Prepare to buy |
| Cause Building (B) | Extended consolidation | Steady on dips | Accumulate positions |
| Spring/Test (C) | False breakouts, quick reversals | Spike then fade | Enter positions |
| Markup (D) | Strong trending moves | Expanding on breakouts | Ride the trend |
The beauty of this phase analysis is its universal application. Whether you're trading EUR/USD on 4-hour charts or GBP/JPY on daily timeframes, these phases repeat with remarkable consistency.
“Volume Spread Analysis (VSA) is the Wyckoff Method's secret weapon – it's like having X-ray vision into market intentions.”
3Volume Spread Analysis: The Wyckoff X-Ray Machine
Volume Spread Analysis (VSA) is the Wyckoff Method's secret weapon – it's like having X-ray vision into market intentions. While most traders obsess over price patterns, VSA reveals the relationship between price movement (spread), volume, and the closing price position within each bar.
Think of it this way: if price is what happened, volume is who made it happen and how badly they wanted it to happen.
The Three Pillars of VSA:
- Spread (Range): The difference between high and low of each bar
- Volume: The number of transactions during that period
- Close: Where price closes relative to the high and low
Here's how to decode common VSA signals on your MT5 charts:
High Volume + Narrow Spread + Close at Midpoint = Absorption
When you see this on EUR/USD, it means smart money is absorbing all available supply or demand. If this occurs near resistance, institutions are likely accumulating (buying) all the selling pressure. Near support, they're distributing (selling) into buying pressure.
Low Volume + Wide Spread + Close Near High/Low = No Interest
This combination suggests the move lacks institutional backing. That 150-pip GBP/USD rally might look impressive, but if it happened on pathetic volume with a close near the high, professional money isn't participating. These moves often reverse quickly.
High Volume + Wide Spread + Close at Opposite End = Climactic Action
This is your Selling Climax or Buying Climax – emotional extremes where amateur traders capitulate and smart money steps in as the contrarian force.
Practical VSA Application Example:
On USD/JPY 4-hour charts, you notice:
- Bar 1: Wide down bar, high volume, close near low (selling pressure)
- Bar 2: Narrow range, high volume, close at midpoint (absorption)
- Bar 3: Up bar, increased volume, close near high (demand returning)
This sequence suggests selling climax followed by smart money absorption and the beginning of accumulation.
VSA Warning Signs:
Beware of "effort vs. result" mismatches:
- High volume with narrow spreads (someone's absorbing)
- Wide spreads with low volume (no professional interest)
- Strong moves that can't sustain their closing levels (weakness)
| VSA Signal | Volume | Spread | Close Position | Interpretation |
|---|---|---|---|---|
| Accumulation | High | Narrow | Mid-range | Smart money absorbing supply |
| Distribution | High | Narrow | Mid-range | Smart money absorbing demand |
| No Demand | Low | Wide | Near Low | Weak selling, potential bounce |
| No Supply | Low | Wide | Near High | Weak buying, potential decline |
| Test | Low | Narrow | Hold level | Checking for supply/demand |
Remember, VSA works best when combined with Wyckoff phase analysis. A high-volume narrow spread bar means different things in accumulation versus distribution phases.
4Setting Up Wyckoff Analysis on MetaTrader 5
Unlike traditional indicators that plot pretty lines, implementing the Wyckoff Method on MT5 requires a strategic combination of tools and chart setup. You're not looking for buy/sell signals – you're building a smart money detection system.
Essential MT5 Setup Components:
1. Volume Configuration
The default MT5 volume indicator shows tick volume, which works perfectly for Wyckoff analysis in forex. Right-click your chart, select "Volumes," and choose "Volumes." Set the color to something that stands out – bright blue or yellow works well.
For enhanced volume analysis, consider adding:
- Volume Weighted Average Price (VWAP)
- On Balance Volume (OBV)
- Accumulation/Distribution Line
2. Support and Resistance Framework
Draw horizontal lines at key levels where smart money previously showed interest. These aren't your typical retail support/resistance levels – focus on:
- Previous selling/buying climax levels
- Spring and upthrust points
- Phase boundaries (accumulation/distribution ranges)
3. Timeframe Selection Strategy
Wyckoff analysis works across all timeframes, but your primary analysis should occur on daily charts with confirmation from 4-hour charts. Here's the hierarchy:
- Weekly: Identify major phase (accumulation, markup, distribution, markdown)
- Daily: Primary Wyckoff analysis and phase identification
- 4-Hour: Entry timing and VSA confirmation
- 1-Hour: Precise entry and exit points
Practical Setup Example - EUR/USD Analysis:
- Weekly Chart Review: Identify that EUR/USD completed a markdown phase and entered potential accumulation
- Daily Chart Analysis: Look for accumulation characteristics – selling climax, automatic rally, secondary tests
- 4-Hour Confirmation: Wait for spring or successful test on reduced volume
- 1-Hour Entry: Enter on sign of strength with volume confirmation
Custom Wyckoff Indicator Options:
Several MT5-compatible indicators can enhance your Wyckoff analysis:
- Wyckoff Wave: Automatically identifies market phases
- VSA Indicator: Highlights volume-spread relationships
- Smart Money Concepts (SMC): Modern adaptation of Wyckoff principles
Chart Template Setup:
| Timeframe | Primary Use | Key Elements |
|---|---|---|
| Weekly | Phase identification | Major S/R, trend direction |
| Daily | Main analysis | VSA, phase boundaries, springs |
| 4-Hour | Confirmation | Volume patterns, mini-phases |
| 1-Hour | Entry/Exit | Precise timing, stop placement |
Analysis Workflow:
- Morning Review (15 minutes): Check weekly phase status across major pairs
- Daily Analysis (30 minutes): Detailed Wyckoff analysis on 3-5 selected pairs
- Real-time Monitoring: Watch for spring/upthrust setups on 4H/1H charts
- Evening Review (10 minutes): Update phase status and prepare next day's watchlist
Pro Tips for MT5 Wyckoff Setup:
- Save multiple chart templates for different analysis phases
- Use alerts for key level breaches rather than constant monitoring
- Keep a trading journal noting phase transitions and their outcomes
- Practice phase identification on historical data before live trading
Remember, the Wyckoff Method isn't about perfect prediction – it's about reading market structure and positioning yourself alongside smart money rather than against it.

Setting up your MT5 indicators like a true Wyckoff scholar - every parameter matters!
“Mastering the Wyckoff Method goes beyond recognizing phases – it requires understanding the psychological warfare between smart money and retail traders, then positioning yourself on the winning side.”
5Advanced Wyckoff Trading Strategies and Common Pitfalls
Mastering the Wyckoff Method goes beyond recognizing phases – it requires understanding the psychological warfare between smart money and retail traders, then positioning yourself on the winning side.
The "Spring" Trade Setup - Your Highest Probability Entry
The spring is Wyckoff's most reliable signal, but it requires patience and precise execution. Here's how to trade it properly:
GBP/USD Spring Example:
- Identify accumulation range: 1.2400-1.2600 (200 pips)
- Wait for false breakdown below 1.2400 on high volume
- Enter long when price reclaims 1.2400 with volume confirmation
- Stop loss: 50 pips below spring low (1.2350)
- Target: Top of accumulation range (1.2600) = 200-pip reward
- Risk/Reward: 1:4 ratio
Advanced Spring Variations:
- Double Spring: Two failed breakdowns create even stronger setup
- Spring on Test: Occurs during secondary test phase, often more subtle
- Terminal Spring: Final shakeout before major markup begins
The Distribution Upthrust Strategy
While everyone chases breakouts, smart Wyckoff traders fade false upthrusts in distribution phases:
EUR/USD Distribution Example:
- Identify distribution range: 1.0800-1.1000
- Wait for false breakout above 1.1000 on climactic volume
- Enter short when price fails back into range
- Stop: 50 pips above upthrust high
- Target: Support area around 1.0850-1.0800
Volume Confirmation Techniques:
The difference between profitable and losing Wyckoff trades often comes down to volume interpretation:
Bullish Volume Signs:
- Higher volume on up bars vs. down bars
- Volume expansion on range breakouts
- Reduced volume on pullbacks (tests)
Bearish Volume Warnings:
- High volume with narrow spreads (absorption)
- Wide range bars closing poorly despite volume
- Volume declining on continued price advance
Common Wyckoff Trading Mistakes (And How to Avoid Them):
Mistake #1: Phase Misidentification Many traders see accumulation where distribution exists. Solution: Always start with weekly/daily timeframe context before drilling down.
Mistake #2: Premature Entry Jumping in during Phase B consolidation instead of waiting for Phase C confirmation. The spring/upthrust is your green light – not the accumulation range itself.
Mistake #3: Ignoring Volume Context Focusing only on price patterns while ignoring volume tells half the story. In forex, even tick volume provides crucial smart money insights.
Mistake #4: Wrong Timeframe Focus Trying to trade 15-minute Wyckoff signals while ignoring daily phase structure. Always trade in harmony with the larger timeframe phase.
Multiple Timeframe Wyckoff Approach:
| Decision | Primary Timeframe | Confirmation Timeframe |
|---|---|---|
| Phase Identification | Daily | Weekly |
| Entry Timing | 4-Hour | 1-Hour |
| Stop Placement | 4-Hour | Daily structure |
| Profit Targets | Daily | Weekly structure |
Advanced Wyckoff Concepts:
Composite Man Psychology: Trade like you ARE the big money. Where would you accumulate? How would you shake out weak hands? This mindset shift transforms your market perspective.
Effort vs. Result Analysis: When USD/JPY climbs 200 pips on declining volume with poor closes, that's maximum effort producing minimal result – a warning sign.
Background vs. Foreground Action: The quiet accumulation happening in background (narrow ranges, steady volume) often matters more than dramatic foreground moves (gaps, spikes).
Risk Management in Wyckoff Trading:
- Never risk more than 2% per trade, even on "perfect" springs
- Use phase structure for stop placement, not arbitrary pip amounts
- Scale out positions as price reaches phase targets
- Keep detailed records of phase identification accuracy
The Wyckoff Method isn't a get-rich-quick scheme – it's a systematic approach to reading market structure that improves with experience. Focus on becoming an expert at phase identification before worrying about perfect entry timing.
Frequently Asked Questions
Q1Does the Wyckoff Method work in modern forex markets with algorithmic trading?
Absolutely. In fact, algorithmic trading has made Wyckoff principles even more relevant. High-frequency trading algorithms still follow supply and demand laws, and institutional accumulation/distribution patterns remain consistent. The key difference is that phases might complete faster than in Wyckoff's era, but the underlying smart money behavior hasn't changed. Major banks and hedge funds still need to accumulate large positions gradually to avoid moving markets against themselves. If anything, retail algorithmic trading creates more noise that Wyckoff analysis helps you filter out, focusing on genuine institutional activity rather than random price spikes.
Q2How long does it take to master Wyckoff Method phase identification?
Most traders need 3-6 months of consistent study to reliably identify Wyckoff phases, but true mastery takes 1-2 years. Start by spending 30 minutes daily analyzing completed phases on historical charts – this builds pattern recognition without emotional pressure. Focus first on obvious accumulation and distribution examples before attempting real-time analysis. Keep a trading journal noting your phase identifications and their outcomes. The learning curve accelerates once you start thinking like the 'Composite Man' rather than a retail trader. Practice on 3-5 major pairs initially, then expand your analysis as confidence grows.
Q3What's the difference between Wyckoff Method and Smart Money Concepts (SMC)?
Smart Money Concepts is essentially a modern rebranding of Wyckoff principles with updated terminology. Where Wyckoff talks about 'accumulation,' SMC uses 'order blocks.' Wyckoff's 'spring' becomes SMC's 'liquidity grab.' Both methods focus on institutional trading behavior, supply and demand zones, and market structure analysis. SMC tends to emphasize shorter timeframes and adds concepts like 'fair value gaps,' while traditional Wyckoff focuses more on complete market cycles and volume analysis. Both approaches work well – choose based on your preferred terminology and timeframe focus. Many successful traders blend elements from both methodologies.
Q4Can I use Wyckoff Method for scalping or only swing trading?
While Wyckoff Method works across all timeframes, it's most effective for swing trading (holding positions for days to weeks). The method's strength lies in identifying major institutional campaigns that unfold over time, not quick scalping opportunities. However, you can use Wyckoff principles for shorter-term trading by analyzing mini-accumulation and distribution phases on 1-hour or 4-hour charts. The key is maintaining timeframe consistency – if you're scalping 15-minute springs, ensure they align with larger timeframe phase structure. Most successful Wyckoff traders focus on daily chart analysis with 4-hour chart entries rather than pure scalping approaches.
Q5Which currency pairs work best with Wyckoff Method analysis?
Major currency pairs (EUR/USD, GBP/USD, USD/JPY, USD/CHF) work best because they have the highest institutional participation and clearest volume patterns. EUR/USD is ideal for beginners due to its liquid nature and well-defined phases. GBP pairs often show more dramatic Wyckoff phases with clear springs and upthrusts. Avoid exotic pairs initially as they may lack sufficient institutional activity to create reliable Wyckoff patterns. Commodity currencies (AUD/USD, CAD/USD) can work well but require understanding of underlying commodity cycles. Focus on 2-3 major pairs initially to develop expertise before expanding to other instruments.
Top Brokers
About the Author
Daniel Harrington
Senior Trading Analyst
Daniel Harrington is a Senior Trading Analyst with a MScF (Master of Science in Finance) specializing in quantitative asset and risk management. With over 12 years of experience in forex and derivatives markets, he covers MT5 platform optimization, algorithmic trading strategies, and practical insights for retail traders.
Use This Indicator
Risk Disclaimer
Trading financial instruments carries significant risk and may not be suitable for all investors. Past performance does not guarantee future results. This content is for educational purposes only and should not be considered investment advice. Always conduct your own research before trading.