

I remember staring at the screen in my Lagos flat in late 2023, watching the USD/NGN rate on my broker's platform.

Olumide Adeyemi
Nhà tiên phong Giao dịch Tây Phi ·  Nigeria
☕ 10 phút đọc
Bạn sẽ học được:
- 1The Three Main Chart Types: Which One Actually Works Here?
- 2Choosing Your Timeframe: Matching Lagos Pace to Market Pace
- 3key-chart-levels
- 4Indicators & Overlays: Cutting Through the Clutter
- 5Your Broker's Platform: MT5, cTrader, and the Nigerian Experience
- 6Mistakes I Made (So You Don't Have To)
- 7Building Your Own Chart Reading Process
I remember staring at the screen in my Lagos flat in late 2023, watching the USD/NGN rate on my broker's platform. The chart was a mess of noise - tiny, frantic candles on a one-minute timeframe. I was trying to scalp, convinced I could catch the CBN's next move. I lost 15% of my account in two days. The problem wasn't the market; it was my chart. I was using the wrong tool for the job, and it cost me real Naira. That painful lesson taught me that in Nigeria, with our unique volatility and broker limitations, choosing and reading your forex trading charts isn't just a skill, it's a survival tactic.
Most platforms offer three views: line, bar, and candlestick charts. Forget the line chart for active trading. It's fine for a quick glance at the USD/NGN trend on Bloomberg, but it hides too much. You need to see the battle between buyers and sellers, especially in our market where liquidity can dry up fast.
Candlestick charts are the universal language for a reason. Each 'candle' shows the open, high, low, and close for your chosen period. That wick shooting up? That's the price getting rejected. That's information you need. I made my first consistent profits on GBP/NGN by spotting simple candlestick patterns like bullish engulfing bars after a dip, but only after I switched from line charts.
Bar charts (or OHLC charts) give you the same data, just in a different visual format. Some old-school traders prefer them. Personally, I find candles faster to read when you're monitoring three or four pairs at once.
The Nigerian Reality Check
Here's the local twist. When you're trading exotic pairs like GBP/NGN or EUR/NGN, the data on your chart might be synthetic. Many international brokers don't offer a true, liquid Naira spot pair. Instead, they create a CFD based on the USD/NGN rate and the EUR/USD rate. This can sometimes lead to weird, sticky price action on the chart that doesn't perfectly match the real interbank rate. Always cross-reference with a trusted external source like the CBN's website or a financial data terminal if you can.
Warning: Don't rely solely on your broker's chart for Naira-based exotics. The spread is often massive (think 50-100 pips or more), and the price might not update as fluidly as majors like the EUR/USD. This makes short-term charts almost useless for these pairs.

💡 Mẹo của Winston
A clean chart is a smart chart. If you can't see the price action for all the indicators, you're not analyzing, you're decorating. Start with a bare candlestick chart and only add a tool when you can precisely articulate what problem it solves.
“The problem wasn't the market; it was my chart. I was using the wrong tool for the job, and it cost me real Naira.”
This is where I blew up my first account. I was trading off the 1-minute and 5-minute charts, reacting to every little blip. In Nigeria, with our sometimes unstable internet and the wider spreads on many accounts, this is a recipe for disaster. The 'noise' will eat you alive.
For new traders in Nigeria, start with the higher timeframes. The 4-hour and daily charts are your best friends. They filter out the meaningless volatility and show you the actual trend. Is the USD/NGN in a steady uptrend on the daily chart? Then maybe stop trying to pick short-term tops. I learned this the hard way trying to fight the central bank's direction.
A Practical Timeframe Strategy
I now use a top-down approach. I find the trend on the daily chart. Then, I zoom into the 4-hour chart to find a general area for an entry. Finally, I use the 1-hour or 30-minute chart to pinpoint my exact entry and set my stop-loss. This keeps me aligned with the bigger picture. For a more active approach like scalping, you need a broker with razor-thin spreads and stable execution, which can be a challenge to find here.
Pro Tip: If your internet is prone to dropping (we've all been there), avoid very short timeframes. A disconnection during a 1-minute scalp can mean a missed exit and a huge loss. Stick to 15-minute charts or higher to give yourself a buffer.
“A break of a strong trendline often signals a potential trend change. But be honest - don't force the line to fit.”
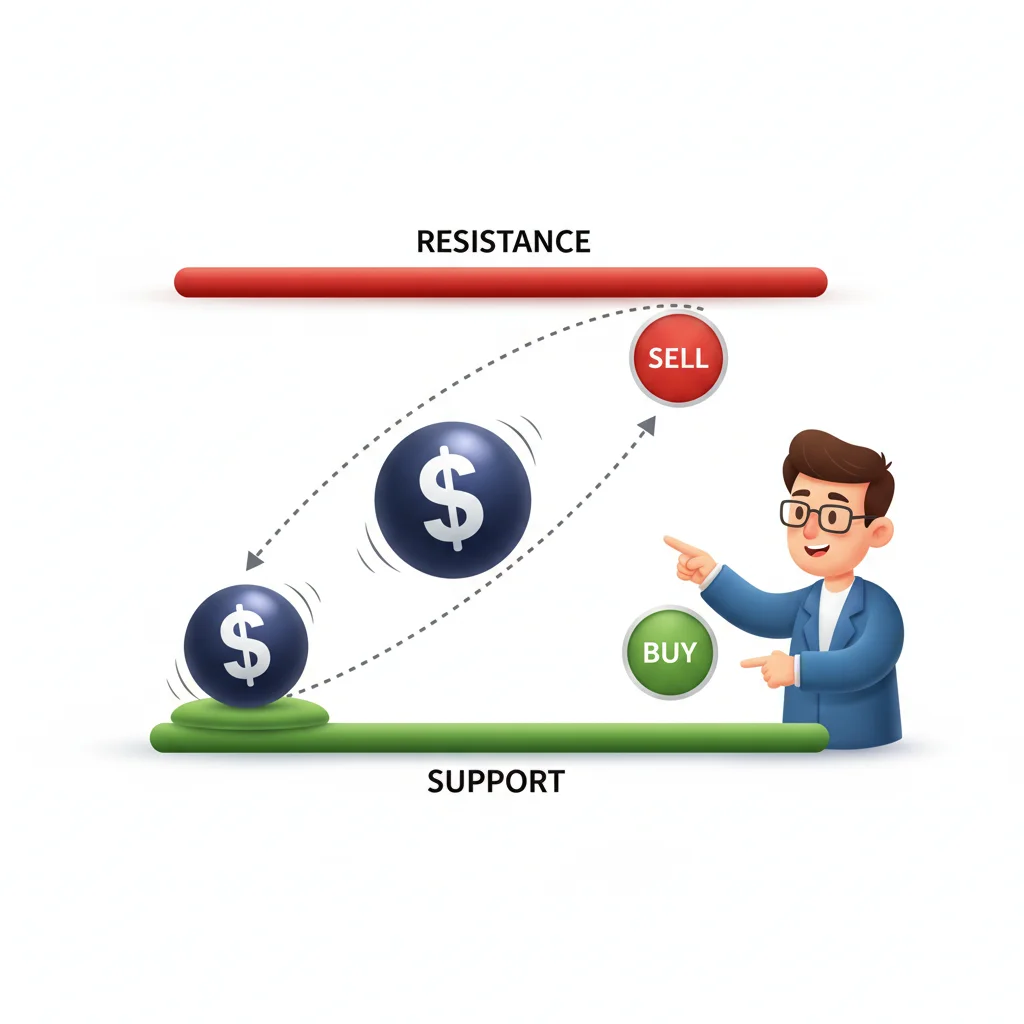
Charts aren't just pretty pictures, they're maps of past price battles. Support and resistance levels are the front lines. Support is where buying tends to come in, resistance is where selling kicks in. Drawing these levels on your USD/NGN chart is more valuable than any fancy indicator.
I keep it simple. I look for:
- Recent Swing Highs/Lows: The last few peaks and troughs on the chart.
- Psychological Levels: Round numbers. USD/NGN at 1,500? That's a massive magnet for price action.
- Consolidation Areas: Where the price has chopped around for a while. Once it breaks out, that area often becomes support or resistance.
Here's a real example from my journal. In early 2024, Gold (XAU/USD) kept bouncing around $2,020. I drew a horizontal line there. When it finally broke above and then pulled back, it touched that same line (now support) and rocketed higher. I took a long position on that retest and rode it for a 3.5% gain. The chart told the story. You can apply this same logic to any instrument, even the XAU/USD.
Trendlines are the next step. Connect a series of higher lows in an uptrend or lower highs in a downtrend. A break of a strong trendline often signals a potential trend change. But be honest - don't force the line to fit. If you're redrawing it constantly, it's not a valid trendline.
“A break of a strong trendline often signals a potential trend change. But be honest - don't force the line to fit.”
The indicator rabbit hole is deep. You can cover your chart with so many squiggly lines that you can't even see the price. I've done it. My chart had the MACD indicator, RSI, Stochastic, Bollinger Bands, and three moving averages. It was a rainbow of confusion.
Simplify. Pick one or two indicators that serve a specific purpose and understand them inside out.
- Moving Averages (MAs): These smooth out price action to show the trend. The 50-period and 200-period Exponential Moving Average (EMA) are widely watched. When the price is above the 200 EMA, the long-term trend is generally up. In a trending Naira pair, these can help you stay on the right side.
- RSI Indicator (Relative Strength Index): Measures whether a market is overbought or oversold. An RSI above 70 suggests overbought, below 30 suggests oversold. Crucial warning: in a strong trend, the RSI can stay overbought or oversold for a very long time. Don't use it alone to call a top or bottom.
- Volume: This is an overlay, not an indicator. It shows how much is being traded. A price move on high volume is more significant than one on low volume. It can confirm breakouts or warn of weak moves.
My current setup? A clean candlestick chart with the 50 EMA (blue) and 200 EMA (red), and the RSI at the bottom. That's it. More tools just gave me more excuses to ignore the plain price action.
Example: Let's say you're using a position size calculator for a trade. Your entry and stop-loss are defined by the chart - maybe a support break. The indicator (like the RSI being oversold) just gives you a bit more confidence in the setup. The chart provides the hard numbers for your risk.
💡 Mẹo của Winston
The most important level on your chart is not support or resistance, it's your stop-loss. That's the line that defines your mistake. Place it where the chart proves your trade idea wrong, not where your pain threshold is.
“The indicator rabbit hole is deep. You can cover your chart with so many squiggly lines that you can't even see the price.”
You can have all the knowledge in the world, but if your broker's charting software is slow, unreliable, or lacks basic tools, you're fighting with one hand tied behind your back.
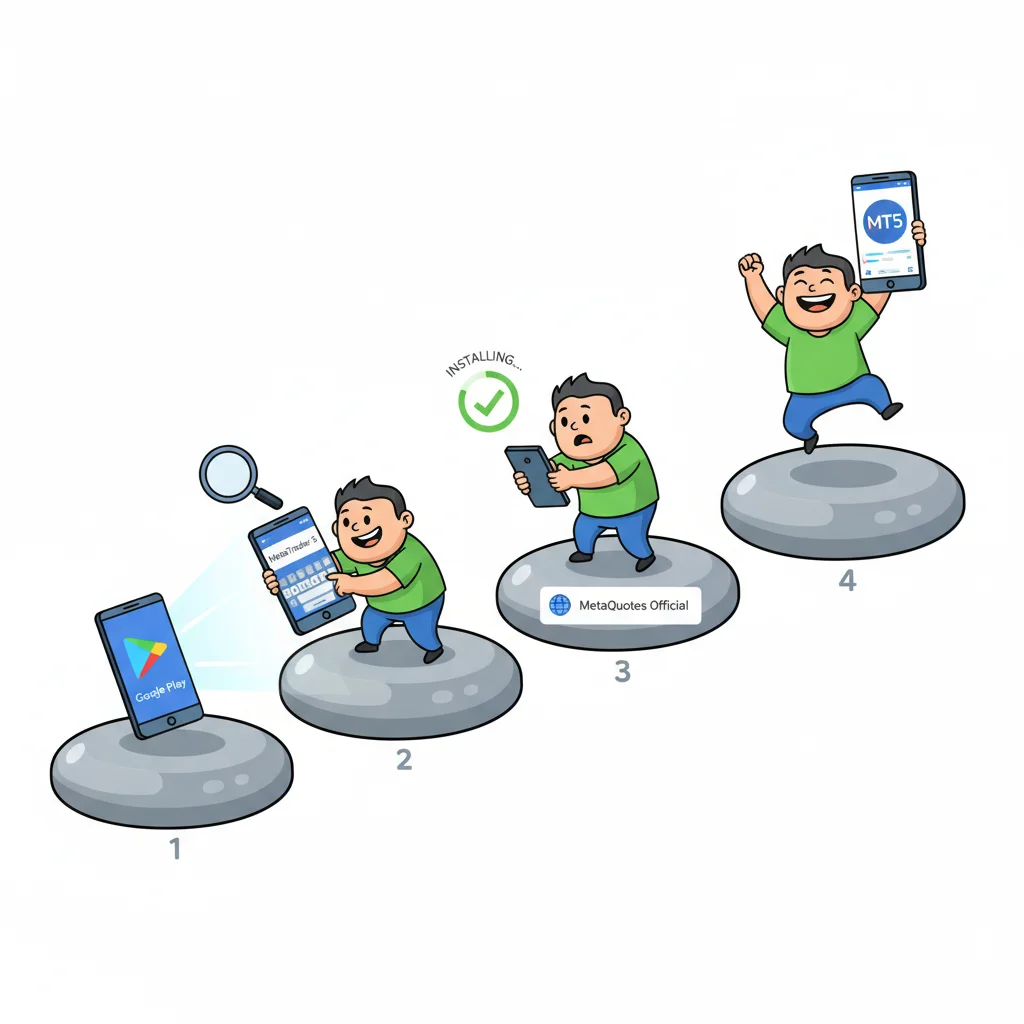
Most Nigerian traders use MetaTrader 4 or 5 (MT4/MT5). It's the industry standard for a reason: it's stable, has thousands of indicators and Expert Advisors (EAs), and is supported by almost every broker, including those popular here like Exness, IC Markets, and XM. MT5 is the newer version with more timeframes and a built-in economic calendar.
cTrader is another excellent platform offered by some brokers like Pepperstone. It has cleaner, more modern charts and superior order execution transparency in my opinion. However, its community and library of custom indicators are smaller than MT5's.
The key question for us: How does it perform on a typical Nigerian internet connection? MT4/5 tends to be more lightweight and forgiving of intermittent connections. The charts might take a second to load, but the platform usually remains stable. Always test the platform on a demo account first to see how it behaves with your specific internet setup.
Beyond the Basic Platform
This is where external tools can change the game. Using a basic MT5 chart is fine, but professional tools add layers of efficiency. For instance, having a tool that lets you drag and drop orders directly onto the chart, set multiple take-profit levels for partial closes, or automate a trailing stop can save you from costly emotional decisions during a volatile Naira move. Managing a prop firm challenge with strict daily loss limits becomes less stressful when you have software that can track and enforce those rules automatically for you, right on your chart.
Manually moving stop-losses and calculating partial closes on volatile charts is stressful; a tool that automates this directly on your MT5 chart lets you focus on analysis.
Pulsar Terminal
Công cụ MT5 tất-cả-trong-một: đặt lệnh kéo-thả, multi-TP/SL, trailing stop, grid trading, Volume Profile và bảo vệ prop firm. Hơn 1.000 trader sử dụng mỗi ngày.

“The indicator rabbit hole is deep. You can cover your chart with so many squiggly lines that you can't even see the price.”
Let's get honest about the errors. We all make them, but in Nigeria, some are more costly.
- Trading Against the Higher Timeframe Trend: My 2023 disaster. The daily chart for USD/NGN was screaming UP. I was on the 5-minute chart trying to short every little pullback. I was a mosquito trying to stop a truck. The trend is your friend, especially in a controlled market like ours.
- Ignoring the Spread on the Chart: You see a support level at 1,520. You place a buy order at 1,520. Your order fills at 1,523. Why? The spread. That 3-pip difference is your cost of doing business. If your stop-loss is 10 pips away, you've just increased your risk by 30% before you even start. Always factor in the live spread definition when placing orders near key levels.
- Overcomplicating Everything: I spent months searching for the 'perfect' indicator combination instead of learning to read pure price action. The chart already tells you everything. The indicators are just a secondary opinion.
- Not Adjusting for Naira Pairs: Treating GBP/NGN like EUR/USD. The spreads are wider, the moves can be jumpier, and the liquidity is different. Use longer timeframes and wider stop-losses for Naira exotics.
- Risking Too Much on One Chart Pattern: You see a perfect head and shoulders, you go all in. The pattern fails. Now what? No single chart formation is a guarantee. Always use a stop-loss. I've seen a perfect setup ruined by an unexpected CBN circular more than once. Protect your capital, because a margin call in this market can wipe you out fast.
💡 Mẹo của Winston
In Nigeria, your first analysis should always be: 'What is the CBN likely to do?' Then, look at the chart. The chart shows you how the market is reacting to that possibility, not the other way around.
“You can have all the knowledge in the world, but if your broker's charting software is slow, you're fighting with one hand tied behind your back.”
This isn't about copying my setup. It's about building a repeatable process that fits your personality, your schedule, and your internet connection.
Step 1: The Scan. Start each day (or session) on the daily chart. What's the overall trend for the 2-3 pairs you follow? No opinions, just observe.
Step 2: The Zoom. Drop to the 4-hour chart. Are there any clear support/resistance levels coming up? Is the price approaching one?
Step 3: The Plan. On the 1-hour chart, formulate a plan. "If price pulls back to this support zone and shows a bullish reversal candle, I will enter long with a stop below the low. My target is the next resistance zone." Write this down.
Step 4: The Execution. Wait for your setup. This is the hardest part. Don't force a trade if the chart doesn't give you your planned signal. Patience is a chart skill.
Step 5: The Review. At the end of the week, look back at your charts. Mark your entries and exits. Why did a trade work? Why did it fail? Was it your analysis, or was it an external event? This feedback loop is how you improve.
For most Nigerian traders, a slower, more deliberate style like swing trading aligns better with our market realities than frantic day trading. It gives you time to think, reduces the impact of spreads, and doesn't require you to be glued to a screen all day.
FAQ
Q1What is the best free charting platform for forex trading in Nigeria?
For most traders, the free charting tools within your broker's MetaTrader 4 or 5 platform are the best starting point. They're reliable, have all the essential features (candlesticks, indicators, drawing tools), and are optimized to work with your live trading account. TradingView also offers an excellent free web-based charting package, but you'll need to manually enter trades on your broker's platform.
Q2How do I account for the wide spreads on Naira pairs when reading charts?
You must mentally add the spread to your risk calculation. If you want to buy at a support level of 1,500.00, and the ask price (the price you buy at) is 1,503.00, your entry is effectively 1,503.00. Draw your support line at 1,500, but place your actual buy order where the broker's ask price hits that level. Always check the live quote, not just the candlestick close, before entering.
Q3Can I use forex chart patterns for trading USD/NGN?
Yes, classic patterns like triangles, flags, and head-and-shoulders do appear. However, you must use them with extreme caution. USD/NGN is heavily influenced by CBN policy and external reserve news, which can override any technical pattern. Use them on higher timeframes (4-hour, daily) for context, not as standalone signals, and always have a tight stop-loss in case of sudden intervention.
Q4Why do my charts sometimes freeze or lag in Nigeria?
This is usually an internet issue, not a chart issue. MT4/5 requires a constant, stable data feed. Fluctuations in your ISP's connection can cause lags. To mitigate this, use a reliable internet source if possible, connect your platform to a server geographically close to you (like your broker's London or Johannesburg server), and avoid trading during peak internet usage hours if your connection is weak.
Q5What timeframe should a complete beginner in Nigeria start with?
Start with the daily chart. It moves slowly, filters out noise, and teaches you about trends and key levels without the stress of minute-to-minute fluctuations. Once you're comfortable identifying support/resistance and trends on the daily, then move to the 4-hour chart to practice planning trades. Avoid anything below the 1-hour chart for at least your first six months.
Q6How many indicators should I have on my chart?
As few as possible. One or two is plenty. I recommend starting with just two moving averages (like the 50 and 200 EMA) to identify the trend, and perhaps the RSI to gauge momentum. More indicators will conflict and paralyze you. The goal is clarity, not complexity.
Q7Is it legal to use charting software from international brokers in Nigeria?
Yes, it is legal for you as an individual to download and use trading platforms like MT5 or cTrader from international brokers that accept Nigerian clients. The legal consideration is on the broker's side to operate appropriately. Your responsibility is to report any trading profits for tax purposes to the FIRS.
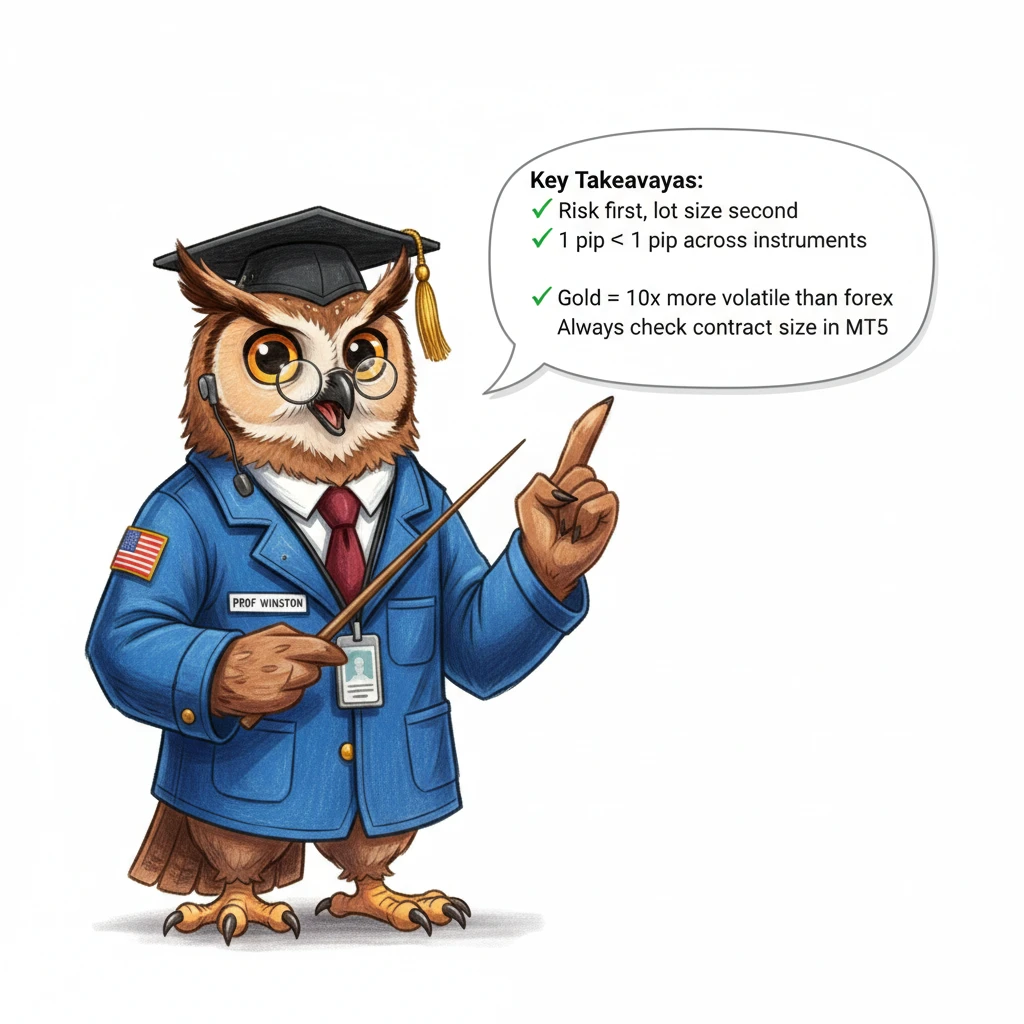
Bài học của Prof. Winston
Điểm chính:
- ✓Start analysis on the Daily chart, trade on the 4-Hour or 1-Hour.
- ✓For Naira pairs, add 30-50 pips to your expected spread.
- ✓Use a maximum of 2 indicators to avoid paralysis.
- ✓Your stop-loss is your most important chart level.
- ✓Always cross-check Naira pair prices with an external source.
Bài viết này hữu ích thế nào?
Nhấp vào ngôi sao để đánh giá
Nhận định giao dịch hàng tuần
Phân tích & chiến lược miễn phí hàng tuần. Không spam.
Về tác giả
Olumide Adeyemi
Nhà tiên phong Giao dịch Tây Phi
Một trong những nhà đào tạo forex tích cực nhất tại Nigeria. 8 năm kinh nghiệm giao dịch từ Lagos. Chuyên về chiến lược vốn thấp và thử thách prop firm dành cho trader châu Phi.
Bình luận
Cảnh báo rủi ro
Giao dịch các công cụ tài chính tiềm ẩn rủi ro đáng kể và có thể không phù hợp với tất cả nhà đầu tư. Hiệu suất trong quá khứ không đảm bảo kết quả trong tương lai. Nội dung này chỉ mang tính chất giáo dục và không nên được coi là lời khuyên đầu tư. Hãy luôn tự nghiên cứu trước khi giao dịch.
Bạn cũng có thể thích

Cara Trading Forex Sukses: 7 Prinsip dari Trader Profesional
Cara trading forex sukses dengan 7 prinsip trader pro: manajemen modal, disiplin, journal trading, backtest. Data nyata, bukan janji profit palsu.
Jam Trading Forex Terbaik untuk Trader Indonesia: Panduan Lengkap dengan Tabel Waktu
Panduan jam trading forex untuk trader Indonesia. Tabel 4 sesi dunia, jam emas 20:00-00:00, sesi mana yang harus dihindari. Data akurat + tips dari trader berpengalaman.
Top 5 Sàn Forex Uy Tín Nhất 2026: Review Jujur dari Trader Indonesia
Top 5 sàn forex uy tín 2026 untuk trader Indonesia. Review jujur: spread, deposit, withdraw, dukungan lokal. Exness, XM, IC Markets & lebih.
Tải Pulsar Terminal
Tất cả các công cụ tính này được tích hợp trong Pulsar Terminal với dữ liệu thời gian thực từ tài khoản MT5 của bạn.
Tải Pulsar Terminal