Aroon Indicator: Settings, Crossover Strategy & Oscillator Guide
Aroon measures the time elapsed since the highest high and lowest low within a period, identifying whether a security is trending and how strong the trend is.

Daniel Harrington
Senior Trading Analyst · MT5 Specialist
☕ 13 min read
Settings — Aroon
| Category | trend |
| Default Period | 25 |
| Best Timeframes | H1, H4, D1 |
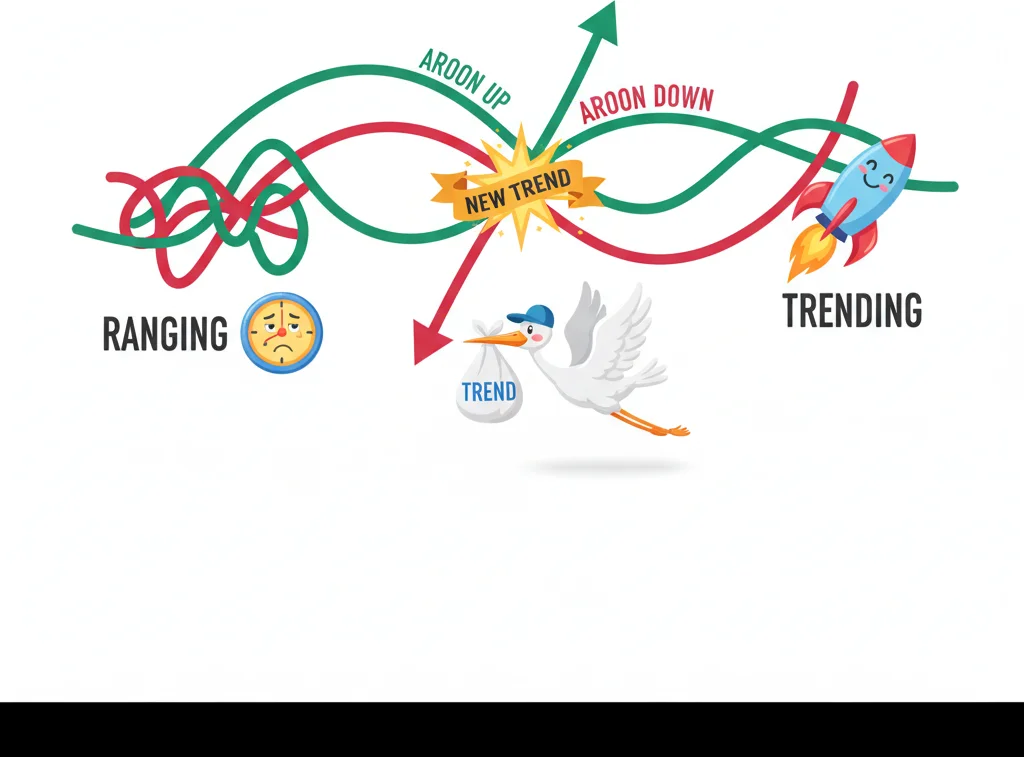
Here is a question most traders never think about: what if the secret to catching a new trend is not measuring how far price has moved, but how recently it moved? That is exactly the insight behind the Aroon indicator. While everyone else is staring at momentum oscillators and moving average slopes, Aroon quietly asks a different question entirely -- when was the last time price hit a new high or low? Developed by Tushar Chande in 1995, this elegantly simple tool flips the traditional price-versus-time relationship on its head. Instead of measuring price relative to time (like most indicators), Aroon measures time relative to price. And that single twist gives it an edge at spotting brand-new trends before they show up on more popular indicators.
Key Takeaways
- The word "Aroon" comes from Sanskrit and translates roughly to "Dawn's Early Light." Tushar Chande chose that name delib...
- Aroon consists of two lines, both oscillating between 0 and 100. Aroon Up measures how recently price hit its highest hi...
- The crossover is the bread-and-butter signal of the Aroon indicator, and the reason Chande named it after dawn -- crosso...
1Sanskrit for 'Dawn's Early Light': The Story Behind Aroon
The word "Aroon" comes from Sanskrit and translates roughly to "Dawn's Early Light." Tushar Chande chose that name deliberately -- the indicator was designed to catch the very first rays of a new trend, the way dawn signals the start of a new day before the sun fully rises.
Chande introduced Aroon in 1995, a period when the technical analysis community was drowning in variations of the same theme: momentum oscillators, moving average systems, and overbought/oversold readings. Most of these tools answered the question "how strong is the current move?" Chande wanted to answer a fundamentally different question: "how fresh is this move?"
The distinction matters more than it sounds. A currency pair can rally 200 pips, and RSI will dutifully register the strength of that move. But RSI cannot tell you whether that rally happened yesterday or three weeks ago. Aroon can. If the highest high within your lookback period occurred on the most recent bar, Aroon Up reads 100. If it occurred 25 bars ago, it reads 0. The entire indicator is built on one variable: recency.
Chande was an accomplished quantitative analyst with a background in engineering -- not a Wall Street trader. That academic perspective shows in the indicator's design. There are no arbitrary smoothing factors, no weighted moving averages, no exponential decay. The formula is direct arithmetic. It takes the number of periods since a high or low occurred, divides by the total lookback period, and converts the result to a percentage. No hidden complexity, no black box.
This simplicity is both a strength and a limitation. Aroon will never win a beauty contest for mathematical sophistication. But it does something that more complex indicators often struggle with: it gives you a clean, unambiguous answer about whether price is making fresh highs, fresh lows, or neither. And in a world where traders paralyze themselves with conflicting signals from five different oscillators, that clarity has real value.
Chande published the indicator in the September 1995 issue of Stocks & Commodities magazine, alongside a companion tool -- the Aroon Oscillator -- which we will cover later. Both tools gained steady adoption over the following decade, particularly among forex and futures traders who valued their ability to identify trending versus ranging conditions quickly.
One thing worth noting: Chande also developed the Chande Momentum Oscillator (CMO) around the same period. If you look at both tools together, you can see a consistent philosophy -- Chande was obsessed with finding cleaner, more direct ways to measure trend behavior without the signal distortion that smoothing introduces. Aroon is the purest expression of that philosophy.

Aroon means "dawn" in Sanskrit — it was designed to catch trends at first light, before everyone else sees them.
2Aroon Up and Aroon Down: A Brilliantly Simple Concept
Aroon consists of two lines, both oscillating between 0 and 100. Aroon Up measures how recently price hit its highest high within the lookback period. Aroon Down measures how recently price hit its lowest low. The default lookback period is 25 bars.
The formulas are about as straightforward as it gets in technical analysis:
| Component | Formula | Range |
|---|---|---|
| Aroon Up | ((25 - periods since 25-period high) / 25) x 100 | 0 to 100 |
| Aroon Down | ((25 - periods since 25-period low) / 25) x 100 | 0 to 100 |
| Aroon Oscillator | Aroon Up - Aroon Down | -100 to +100 |
Let's walk through a real example. You are looking at EUR/USD on the D1 chart with a 25-period Aroon. Suppose the highest high in the last 25 days occurred 3 days ago. Aroon Up = ((25 - 3) / 25) x 100 = 88. That is a high reading -- it tells you the bulls are active and making fresh highs recently. Now suppose the lowest low occurred 19 days ago. Aroon Down = ((25 - 19) / 25) x 100 = 24. The bears have not produced a new low in nearly three weeks. Together, these two readings paint a clear picture: uptrend in progress.
Here is how to interpret the key levels:
| Aroon Up | Aroon Down | Market Condition |
|---|---|---|
| Above 70 | Below 30 | Strong uptrend |
| Below 30 | Above 70 | Strong downtrend |
| Both near 50 | Both near 50 | Consolidation / no trend |
| Both declining | Both declining | Momentum fading, range likely |
| 100 | Near 0 | Extreme bullish -- new high on latest bar |
| Near 0 | 100 | Extreme bearish -- new low on latest bar |
The beauty of this system is that no price magnitude enters the calculation. Aroon does not care whether price moved 10 pips or 200 pips to make that new high. It only cares that the high happened recently. This makes the indicator equally readable across different instruments and volatility conditions. A reading of 88 on EUR/USD means the same thing as 88 on Gold or the S&P 500 -- the highest high is 3 bars old out of a 25-bar window.
One thing that trips up beginners: Aroon Up at 0 does not mean price is falling. It means the highest high within the lookback window occurred exactly 25 bars ago -- in other words, there has been zero bullish recency. Price could be perfectly flat and still show Aroon Up at 0. Context from the Aroon Down line is essential for interpretation.
The parallel movement pattern is also worth watching. When both Aroon Up and Aroon Down are declining together from elevated levels, it typically signals that the market is transitioning from a trending phase into consolidation. Neither bulls nor bears are producing fresh extremes, and the indicator is essentially telling you: "nothing new is happening." That is useful information -- it is a warning to avoid directional trades until one line separates from the other.

Like a trader watching for the perfect trend birth - Aroon monitors when highs and lows last occurred.
“The crossover is the bread-and-butter signal of the Aroon indicator, and the reason Chande named it after dawn -- crossovers are designed to catch trends at their very beginning.”
3The Aroon Crossover: Catching Trends at Their Birth
The crossover is the bread-and-butter signal of the Aroon indicator, and the reason Chande named it after dawn -- crossovers are designed to catch trends at their very beginning.
A bullish crossover occurs when Aroon Up crosses above Aroon Down. Translation: the most recent high is now fresher than the most recent low. Bulls are generating new highs more recently than bears are generating new lows. A bearish crossover is the mirror -- Aroon Down crosses above Aroon Up, meaning fresh lows are arriving more frequently than fresh highs.
Not all crossovers carry equal weight. Here is a practical quality filter that separates high-probability crossovers from noise:
| Crossover Quality | Conditions | Reliability |
|---|---|---|
| Strong bullish | Aroon Up crosses above Aroon Down from below 30, while Aroon Down was above 70 | High |
| Moderate bullish | Aroon Up crosses above Aroon Down near the 50 level | Medium |
| Weak bullish | Both lines are between 40-60, choppy crossover | Low |
| Strong bearish | Aroon Down crosses above Aroon Up from below 30, while Aroon Up was above 70 | High |
The strongest crossovers happen from extreme levels. If Aroon Down has been sitting above 70 (meaning the market has been making fresh lows consistently) and then Aroon Up surges from below 30 to cross above it, that is a high-conviction signal. The market is transitioning from active bearish behavior to active bullish behavior -- that is the "dawn" Chande was aiming to detect.
Here is a concrete trading setup using Aroon crossovers on the H4 chart. You are watching GBP/USD and notice Aroon Down has been above 70 for several bars while Aroon Up has been languishing below 20. Then Aroon Up starts climbing rapidly and crosses above Aroon Down. Your entry plan: wait for the crossover bar to close, then enter long on the next bar's open. Set your stop loss below the swing low that coincided with the Aroon Down peak (that was the most recent lowest low). For your target, look for the next significant resistance level or use a 1:2 risk-to-reward ratio as a minimum threshold.
A critical warning that experienced Aroon traders learn quickly: do not blindly enter on every crossover. In choppy, range-bound markets, the two lines will weave back and forth across each other constantly, generating a string of losing trades. The solution is to add a confirmation filter. Some effective options include:
- Only take crossovers when the Aroon Oscillator (Aroon Up minus Aroon Down) exceeds +50 or drops below -50
- Require the crossover to align with a breakout above or below a horizontal support/resistance level
- Combine with a 200-period moving average: only take bullish crossovers when price is above the 200 MA, bearish crossovers below it
On the D1 timeframe, Aroon crossovers on major forex pairs typically generate 6 to 10 signals per year with the default 25-period setting. That is not a high frequency -- but the quality tends to be notably better than faster oscillator crossover signals, because the 25-period lookback filters out minor retracements that trigger false signals on shorter-period indicators.
When Aroon Up crosses above Aroon Down, a new uptrend is born — catch it in the cradle.
4Aroon Oscillator: Simplifying Two Lines Into One
If watching two lines feels like one too many, Chande built a solution: the Aroon Oscillator. It is simply Aroon Up minus Aroon Down, producing a single line that oscillates between -100 and +100. Positive values mean bullish conditions (recent highs are fresher than recent lows). Negative values mean bearish conditions. Zero is neutral.
The Aroon Oscillator strips the system down to its essence. Instead of interpreting the relationship between two separate lines, you get one number that tells you the directional bias immediately.
| Oscillator Value | Interpretation |
|---|---|
| +100 | Maximum bullish -- new high on latest bar, low is 25+ bars old |
| +50 to +100 | Strong uptrend |
| +25 to +50 | Moderate bullish bias |
| -25 to +25 | No clear trend / consolidation |
| -50 to -25 | Moderate bearish bias |
| -100 to -50 | Strong downtrend |
| -100 | Maximum bearish -- new low on latest bar, high is 25+ bars old |
The zero-line cross is the oscillator's primary signal, and it corresponds exactly to the Aroon Up/Down crossover. When the oscillator moves from negative to positive, Aroon Up has just crossed above Aroon Down. When it moves from positive to negative, the bearish crossover has occurred. Same signal, cleaner visual.
But the oscillator adds value beyond just simplifying the display. The magnitude of the oscillator reading tells you something the raw crossover does not: how decisive the shift is. An oscillator jumping from -60 to +40 in a few bars is a far more aggressive trend change than one creeping from -5 to +5. The speed and magnitude of the zero-line cross correlate with the strength of the emerging trend.
Here is a practical application. On the H1 chart, you can use the Aroon Oscillator as a trend filter for a separate entry strategy. Suppose you trade pullback entries using support and resistance levels. Before entering a pullback buy, check that the Aroon Oscillator is above +25. Before entering a pullback sell, confirm the oscillator is below -25. This simple filter keeps you aligned with the dominant short-term trend and prevents you from buying pullbacks in a market that has no recent bullish recency.
The oscillator also works well for identifying when to step aside entirely. When it hovers between -20 and +20 for an extended period, the market has no directional commitment. Neither bulls nor bears are producing fresh extremes with any consistency. Some of the best trading decisions are the ones you do not make, and the Aroon Oscillator's neutral zone is essentially a flashing sign that says "no edge here right now."
One nuance traders often miss: the oscillator can stay at extreme values (+80 to +100 or -80 to -100) for extended periods during strong trends. This is not a sign that the trend is overbought or oversold -- Aroon is not a mean-reverting indicator. A sustained reading of +90 means the market keeps making fresh highs near the current bar, which is exactly what a strong trend does. Fading these extremes is a common mistake that leads to fighting a trend in full momentum.
Compared to using the two-line Aroon system, the oscillator sacrifices some granularity. With two lines, you can see situations where both are declining (consolidation) versus one rising while the other falls (trending). The oscillator compresses both scenarios into a single number and loses that distinction. For this reason, many traders keep both versions on their chart -- the two-line Aroon on the main indicator panel and the oscillator as a quick-reference secondary panel.

When you simplify two squiggly lines into one smooth oscillator that actually makes sense.
“Aroon and the Average Directional Index (ADX) are probably the two most-discussed trend identification tools in forex trading.”
5Aroon vs ADX: Two Trend Indicators, Very Different Philosophies
Aroon and the Average Directional Index (ADX) are probably the two most-discussed trend identification tools in forex trading. Both answer the question "is the market trending?" -- but they approach it from completely different angles, and understanding those differences helps you choose the right tool for the right job.
The core philosophical difference: Aroon is time-based, ADX is price-based. Aroon asks "when did the most recent high or low occur?" ADX asks "how much directional movement is price exhibiting compared to its total range?" That distinction creates very different behavioral characteristics.
| Feature | Aroon | ADX |
|---|---|---|
| Basis of calculation | Time since high/low | Directional movement / ATR |
| Shows trend direction | Yes (Up/Down lines) | No (requires +DI/-DI) |
| Shows trend strength | Indirectly (via level readings) | Yes (primary purpose) |
| Smoothing | None | Heavy (Wilder smoothing) |
| Responsiveness | Fast | Slow |
| Default period | 25 | 14 |
| Best for | Early trend detection | Trend strength confirmation |
| False signals in ranges | Moderate | Low (but late to act) |
| Complexity | Simple | Moderate |
Aroon reacts faster because it has zero smoothing in its calculation. When price makes a new 25-period high, Aroon Up instantly jumps to 100. There is no averaging, no exponential decay, no weighted calculation softening the move. ADX, by contrast, uses Wilder's smoothing method -- effectively a running average that introduces deliberate lag. That lag makes ADX more stable and less prone to whipsaws, but it also means ADX is consistently slower to identify new trends.
In practical terms, during a trend reversal on the D1 chart of EUR/USD, you might see Aroon's crossover signal fire 3 to 5 bars before ADX confirms the same trend change by rising above 25. Those 3-5 daily bars represent real edge if you are a swing trader looking for early entries. But they also represent risk -- Aroon's early signal has a higher false positive rate than ADX's confirmed signal.
This is not a competition with a winner. The two indicators complement each other beautifully when used together. A practical combined approach works like this:
- Watch for an Aroon crossover (early warning of potential trend change)
- Wait for ADX to rise above 20-25 (confirmation that the trend has real directional momentum)
- Enter in the direction of the Aroon crossover once ADX confirms
This two-step filter eliminates a significant portion of false Aroon crossovers (which tend to occur in low-ADX environments) while still getting you into confirmed trends earlier than ADX alone would.
Where Aroon clearly wins: identifying the absence of a trend. When both Aroon lines are below 50 and declining, the message is immediate and unambiguous -- no fresh highs, no fresh lows, the market is going nowhere. ADX can tell you the same thing (readings below 20), but it takes longer to get there because of the smoothing lag.
Where ADX clearly wins: measuring trend strength in established moves. Once a trend is underway, ADX's rising line from 25 toward 40 or 50 gives you a reliable gauge of whether the trend is accelerating or decelerating. Aroon tells you the trend exists (Up line near 100) but does not differentiate between a trend that is gaining steam and one that is about to exhaust itself.
The honest take: if you trade primarily on H4 and D1, keeping both indicators available makes sense. Use Aroon for timing -- it will tell you when conditions are shifting. Use ADX for conviction -- it will tell you whether the shift has enough momentum to be worth trading. Together, they cover both the timing and confirmation dimensions that neither tool handles alone.
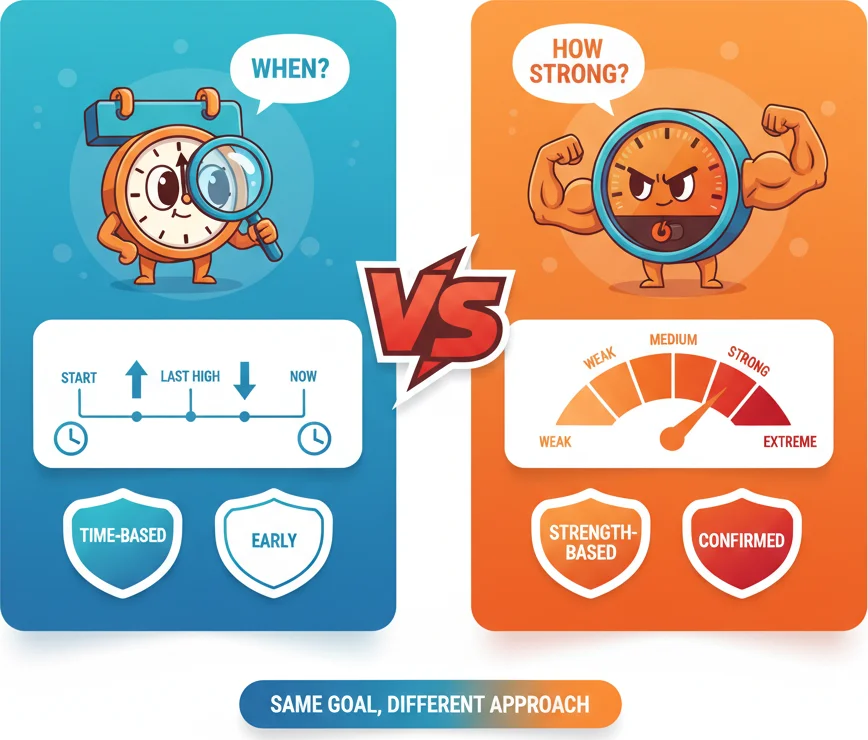
Aroon asks "when was the last high?" while ADX asks "how strong is the move?" Same goal, totally different angles.
Frequently Asked Questions
Q1What is the best period setting for the Aroon indicator?
The default 25-period setting works well on D1 charts, covering roughly five weeks of price action. For H4 charts, 20 to 25 periods is effective. For H1 charts, reducing to 14-20 periods improves responsiveness without generating excessive false signals. On lower-volatility instruments like government bonds, extending to 30-35 on D1 can reduce noise from minor consolidations.
Q2Is the Aroon indicator a leading or lagging indicator?
Aroon is best described as a coincident-to-slightly-leading indicator. Because it has no smoothing and reacts instantly when price makes a new high or low, it often signals trend changes before smoothed indicators like ADX or MACD. However, it is not truly predictive -- it reports what has already happened (a new high or low) rather than forecasting what will happen next.
Q3Can Aroon be used for scalping on M5 or M15 timeframes?
Aroon is not ideal for scalping. On very short timeframes, the recency-based calculation produces frequent crossovers that reverse within a few bars, generating whipsaw losses. The indicator performs best on H1 and above, where individual bars represent enough price action to make recency of highs and lows a meaningful measure. If you must use it on M15, increase the period to 30 or higher and combine it with a volatility filter.
Q4What is the difference between Aroon and the Aroon Oscillator?
The Aroon system uses two lines (Aroon Up and Aroon Down), each ranging from 0 to 100. The Aroon Oscillator is simply Aroon Up minus Aroon Down, creating a single line between -100 and +100. Positive values indicate bullish conditions, negative values indicate bearish conditions. The oscillator is a simplified view -- it loses some nuance (like detecting when both lines are declining together) but makes trend direction immediately visible at a glance.
Q5How do you combine Aroon with other indicators for better results?
Aroon pairs well with ADX for trend confirmation -- use Aroon crossovers as early signals and wait for ADX above 25 to confirm momentum. It also works effectively with support and resistance levels, where an Aroon crossover coinciding with a level breakout provides higher-conviction entries. Adding a 200-period moving average as a directional filter (only taking bullish Aroon signals above it, bearish below) further reduces false signals in ranging markets.
Top Brokers
About the Author
Daniel Harrington
Senior Trading Analyst
Daniel Harrington is a Senior Trading Analyst with a MScF (Master of Science in Finance) specializing in quantitative asset and risk management. With over 12 years of experience in forex and derivatives markets, he covers MT5 platform optimization, algorithmic trading strategies, and practical insights for retail traders.
Use This Indicator
Risk Disclaimer
Trading financial instruments carries significant risk and may not be suitable for all investors. Past performance does not guarantee future results. This content is for educational purposes only and should not be considered investment advice. Always conduct your own research before trading.