ATR Indicator Guide: Average True Range for Stop Loss, Position Sizing & Volatility
ATR measures market volatility by calculating the average range between high and low prices, accounting for gaps between sessions.

Daniel Harrington
Senior Trading Analyst · MT5 Specialist
☕ 16 min read
Settings — ATR
| Category | volatility |
| Default Period | 14 |
| Best Timeframes | M15, H1, H4 |
Most traders first encounter ATR when they realize their fixed 50-pip stop loss gets hit on volatile days and sits uselessly far on quiet ones. That frustration is exactly the problem J. Welles Wilder solved in 1978 when he created the Average True Range. Unlike indicators that try to predict direction, ATR does something more honest: it measures how much an instrument actually moves. That single number, expressed in price units, becomes the foundation for placing stop losses that breathe with the market, sizing positions so every trade risks the same dollar amount, and filtering out dead markets where your edge disappears. If you only ever use one indicator for risk management, this is the one.
Key Takeaways
- J. Welles Wilder had a productive year in 1978. His book "New Concepts in Technical Trading Systems" introduced RSI, Par...
- Here's the single most practical use of ATR, and the one that probably saves more trading accounts than any other applic...
- ATR-based position sizing might be the single biggest upgrade a retail trader can make to their process. It sounds dry —...
1Wilder's Third Masterpiece: Why ATR Measures Volatility Better Than Range
J. Welles Wilder had a productive year in 1978. His book "New Concepts in Technical Trading Systems" introduced RSI, Parabolic SAR, ADX, and — often overlooked alongside those household names — the Average True Range. If RSI became the world's favorite oscillator and ADX the go-to trend strength tool, ATR quietly became the engine under the hood of nearly every serious risk management system.
So why not just use the high-low range of a candle? Because range lies to you whenever there's a gap. If EUR/USD closes Friday at 1.0850, opens Monday at 1.0920 after a weekend news event, and then trades between 1.0915 and 1.0940, the standard range says the candle moved 25 pips. But anyone who held a short over the weekend just experienced a 90-pip move against them. The high-low range completely ignores that gap.
Wilder's fix was elegant. True Range is the largest of three values: the current high minus the current low, the absolute value of the current high minus the previous close, or the absolute value of the current low minus the previous close. Those last two calculations catch the gap. In our Monday example, the True Range would be 1.0940 minus 1.0850 = 90 pips. That's the reality of the volatility a trader experienced.
ATR then smooths these True Range values over a default period of 14 bars using Wilder's own smoothing method: ATR = [(Previous ATR x 13) + Current True Range] / 14. This is functionally similar to an exponential moving average with a smoothing factor of 1/14. The result is a single line plotted below the price chart that rises when volatility expands and falls when the market quiets down.
A few things make ATR stand out from other volatility measures. First, it outputs raw price units, not percentages. An ATR of 15 pips on EUR/USD means the average candle has moved 15 pips over the lookback period. You can plug that number directly into a stop loss calculation without any conversion. Second, ATR is always positive — it measures magnitude of movement, not direction. It won't tell you whether price is going up or down. That's not a limitation; it's the point. You're measuring the size of the waves, not which way the tide flows.
Compared to Bollinger Band width, which also tracks volatility, ATR has a crucial practical advantage: the output is in the same units as your trade. Bollinger Band width gives you a standard deviation measure that needs interpretation. ATR gives you a number you can multiply by 1.5 and subtract from your entry price. Done — you have a stop loss that accounts for current market conditions.
The 14-period default is surprisingly robust. Wilder originally designed it for daily commodity charts, where 14 bars covers roughly three weeks. On modern forex charts, it works well across all timeframes: on H1, 14 bars covers about 14 hours of price action; on H4, roughly 56 hours or two and a half trading days; on D1, three calendar weeks. Some traders shorten to 10 for more sensitivity or extend to 20 for smoother readings, but 14 remains the standard for good reason — it balances responsiveness against noise across virtually every instrument and timeframe.
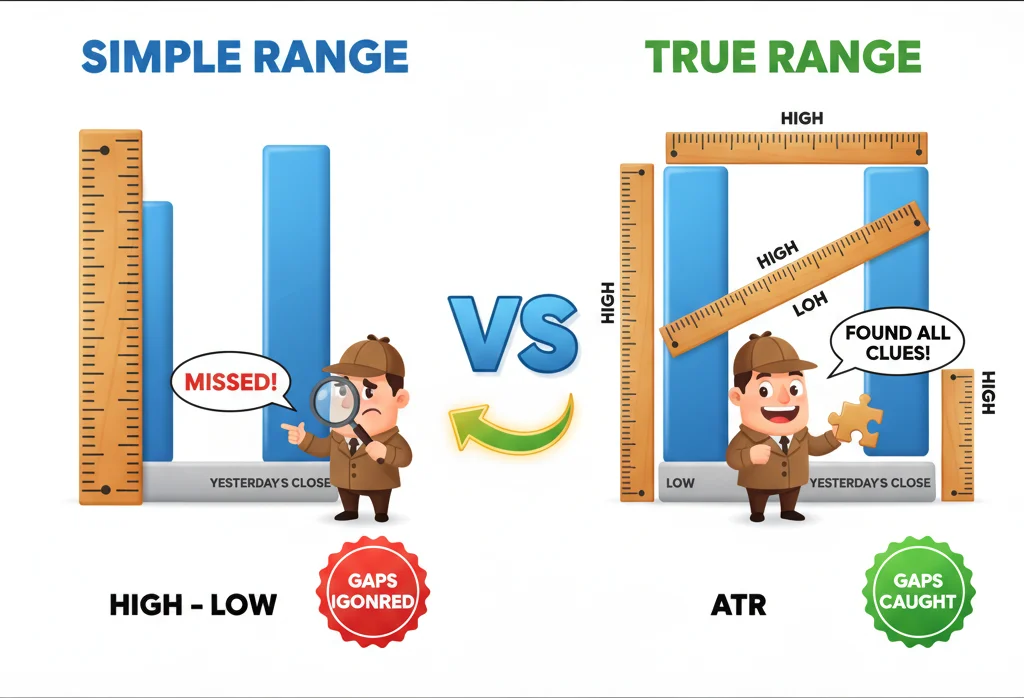
Regular range misses gaps entirely — ATR catches them because it looks at where price actually came from.
2ATR for Stop Loss Placement: The 1.5x ATR Rule
Here's the single most practical use of ATR, and the one that probably saves more trading accounts than any other application of any indicator: setting stop losses based on actual volatility instead of arbitrary round numbers.
The logic is disarmingly simple. If a currency pair's ATR on your trading timeframe is 20 pips, placing your stop loss 10 pips from entry means normal market noise will eat you alive. Placing it 200 pips away means you'll survive the noise but take catastrophic losses when you're wrong. ATR gives you the Goldilocks number — a stop distance wide enough to survive typical fluctuations but tight enough to protect your capital when the trade genuinely goes against you.
The formula: Stop Loss Distance = ATR x Multiplier.
For a long trade: Stop Loss Price = Entry Price - (ATR x Multiplier). For a short trade: Stop Loss Price = Entry Price + (ATR x Multiplier).
The 1.5x multiplier has become something of an industry standard for intraday and short-term swing traders, and for good reason. At 1.0x ATR, you're placing your stop at the average candle range — meaning roughly half of all normal candles would trigger it. That's way too tight. At 2.0x ATR, you're giving the trade considerable room, which works well for longer-duration swing and position trades but sacrifices risk-reward on shorter setups. The 1.5x sweet spot filters out most normal market jitter while keeping you close enough to your entry that the risk-reward math still works.
Let's walk through a real scenario. You're trading EUR/USD on the H4 chart. The 14-period ATR reads 22 pips. You spot a bullish setup and enter long at 1.0880. With a 1.5x ATR stop: 22 x 1.5 = 33 pips. Your stop goes at 1.0847. That 33-pip buffer gives price room to pull back naturally within the established volatility range before continuing in your direction. A fixed 20-pip stop would be smaller than a single average candle — you'd almost certainly get stopped out by noise.
Now here's where it gets interesting. Compare that same setup during a quiet market versus a volatile one. If ATR reads 12 pips during a low-volatility London afternoon, your stop becomes 12 x 1.5 = 18 pips. If ATR reads 35 pips during a Non-Farm Payrolls release, your stop expands to 35 x 1.5 = 52.5 pips. Your stop automatically adapts. You're not manually guessing whether today is a "20-pip stop day" or a "50-pip stop day." ATR tells you.
Multiplier guidelines by trading style:
1.0x ATR works for scalpers on M5 to M15 charts who want tight stops and accept frequent stop-outs in exchange for strong risk-reward when winners run. 1.5x ATR is the workhorse for most intraday and short-term swing traders on H1 to H4. 2.0x to 2.5x ATR suits multi-day swing trades on H4 to D1 where you need space for overnight gaps and wider retracements. 3.0x or higher is for position traders and trend-followers on daily and weekly charts who prioritize staying in moves over minimizing individual trade risk.
One critical rule that many beginners violate: never move your ATR stop further from your entry after placing it. If the market moves against you and your stop is about to be hit, that's the system working as intended. Moving the stop wider transforms a calculated risk into an emotional hope trade — and hope is not a strategy. You can move the stop in your favor as a trailing stop (which we'll cover later), but never backward.
A quick note on ATR stop placement versus structure-based stops. The ideal approach combines both: place your stop at a logical structure level (below a swing low for longs, above a swing high for shorts), then verify that the distance is at least 1.0x ATR. If the structure level is closer than 1.0x ATR, the setup is probably too tight and normal volatility will take you out. If it's much wider than 2.5x ATR, the risk-reward may not justify the trade. When structure and ATR agree on a similar level, you've found a high-quality stop placement.

When your 1.5x ATR stop loss placement is just right - precision timing matters!
“ATR-based position sizing might be the single biggest upgrade a retail trader can make to their process.”
3Position Sizing with ATR: Risk the Same Dollar Amount on Every Trade
ATR-based position sizing might be the single biggest upgrade a retail trader can make to their process. It sounds dry — nobody gets excited about position sizing formulas — but this one concept separates traders who blow up from traders who survive long enough to become profitable.
The core principle: every trade should risk the same dollar amount, regardless of the instrument's volatility. A trade on GBP/JPY (volatile, wide ATR) should risk the same $200 as a trade on EUR/CHF (quiet, narrow ATR). ATR makes this possible by telling you exactly how much to adjust your position size.
The formula is straightforward: Position Size = Dollar Risk per Trade / (ATR x Multiplier).
Let's say you have a $10,000 account and you risk 1% per trade — that's $100. You're trading two setups simultaneously.
Setup 1: EUR/USD, H4 chart. ATR = 18 pips. Using a 1.5x multiplier, your stop distance is 27 pips. At $10 per pip for a standard lot, that's $270 of risk per lot. But you only want to risk $100. So: $100 / $270 = 0.37 lots. You trade roughly 0.37 standard lots (or 3.7 mini lots).
Setup 2: GBP/JPY, same timeframe. ATR = 45 pips. Stop distance: 45 x 1.5 = 67.5 pips. At roughly $6.70 per pip for a standard lot, that's about $452 of risk per lot. Position size: $100 / $452 = 0.22 lots.
Notice what happened: on the volatile pair, you automatically took a smaller position. On the calmer pair, a larger one. Both trades risk exactly $100. If you lose both, you're down $200 — exactly 2% of your account. No surprises. No waking up to find that your GBP/JPY position cost you three times what you intended because you used the same lot size as your EUR/USD trade.
This is what professional traders mean by "equal risk per trade." Without ATR, you'd need to manually research each pair's current volatility and eyeball your position size. With ATR, it's a simple division.
The formula also works in reverse for calculating risk before entering. If you already know you want to trade 0.5 lots of EUR/USD and the ATR stop is 30 pips, your risk is 0.5 x 30 x $10 = $150. Is $150 within your per-trade risk budget? If yes, proceed. If not, reduce the position until the math works.
Here's why this matters so much over a series of trades. Without ATR sizing, traders tend to take the same lot size on every trade. When they happen to trade a quiet instrument, they risk a small amount. When they trade a volatile one, they accidentally risk three or four times as much. Over 50 trades, a few outsized losses on volatile pairs destroy the account even if the win rate is decent. ATR sizing prevents this by ensuring that no single trade can hurt you disproportionately.
A practical tip: build a simple spreadsheet or use the position size calculator already available on this site. Input your account balance, risk percentage, the current ATR value, and your multiplier. The output is your lot size. Do this before every single trade. It takes 30 seconds and might save your account.
For traders using MetaTrader 5, you can display the ATR indicator directly on your chart. Read the current value, multiply by your multiplier to get the stop distance in pips, then use the trading platform's lot calculator to find your correct position size. Some EA tools will do this automatically if you prefer — but understanding the math yourself means you'll catch errors before they become expensive.
One question that comes up frequently: should you recalculate position size if ATR changes while you're in the trade? No. Calculate once at entry and leave it alone. Your position size and stop distance are set when you open the trade. ATR will fluctuate as new bars form, but your original risk calculation was based on the volatility at the time of your decision. Recalculating mid-trade leads to constant tinkering that undermines the whole point of having a system.
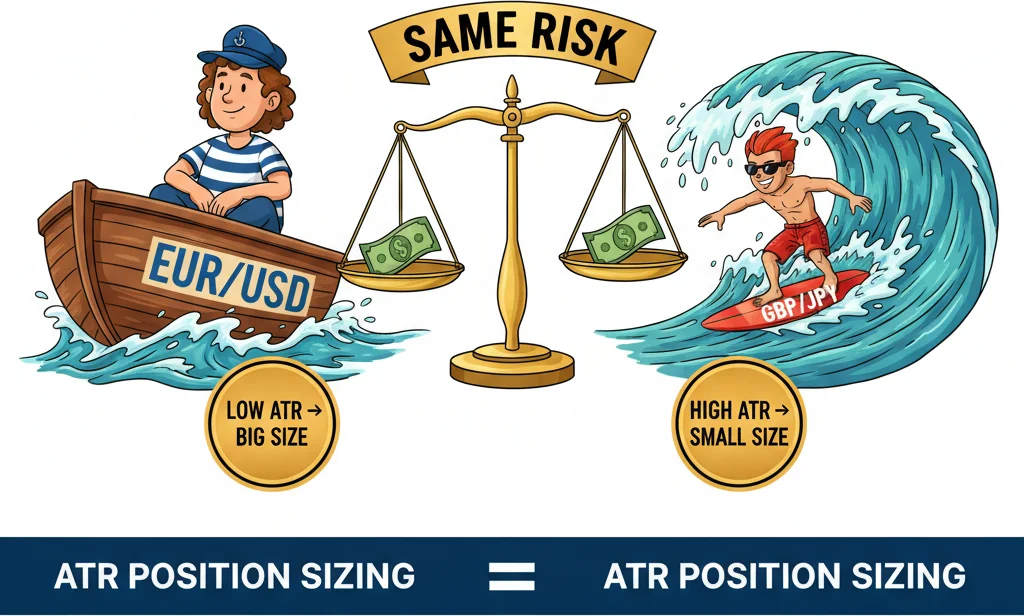
ATR-based position sizing means your calm EURUSD trades and wild GBPJPY trades risk the exact same dollars.
4ATR as a Volatility Filter: When to Trade and When to Wait
Here's an application of ATR that doesn't get nearly enough attention: using it to decide whether you should be trading at all right now.
Every trading strategy has a volatility sweet spot. Breakout strategies need expanding volatility to generate follow-through. Mean-reversion strategies need enough range to create overbought and oversold conditions. Scalping strategies need enough movement to cover the spread and commissions. When volatility collapses, none of these work properly — and that's when traders tend to overtrade, forcing setups that aren't there.
ATR gives you an objective way to measure whether current conditions suit your strategy. The simplest filter: compare the current ATR to its own moving average.
Take the 14-period ATR, then overlay a 50-period simple moving average of that ATR line. When current ATR is above its 50-period average, the market is more volatile than usual — conditions that typically favor breakout and momentum strategies. When ATR is below its average, the market is quieter than normal — a signal to either switch to range-bound strategies or simply stand aside.
This filter alone can dramatically improve your results. Research across major forex pairs suggests that trading during low-ATR periods increases false breakout rates by roughly 30-40% compared to high-ATR periods. That means if you're a breakout trader entering positions when ATR is compressed, roughly one in three of your "breakouts" is actually a fake-out that reverses back into the range. The ATR filter would have kept you out of those trades.
Let's get specific. On EUR/USD H1, an ATR reading above 15 pips typically signals active trending conditions where momentum strategies perform well. Readings between 8 and 15 pips represent normal conditions where most strategies function adequately. Below 8 pips — which happens frequently during the Asian session or between major economic releases — the market is barely moving. Spreads eat a larger percentage of each move, and the risk of being trapped in a dead-money position is high.
The ATR squeeze is one of the most reliable setup conditions in technical analysis. It occurs when ATR drops to multi-period lows — a sustained compression that indicates the market is coiling. Like a spring being pressed down, this compression typically releases into a significant expansion. Historical analysis across major pairs shows that ATR squeezes lasting 20 or more periods are followed by meaningful moves within the next 10-15 bars roughly 65-75% of the time.
The trading rule for squeezes: don't trade during the squeeze itself. Wait for ATR to start rising from those compressed levels. The uptick in ATR is your signal that volatility is expanding and the breakout is beginning. Then apply your directional strategy (support/resistance break, moving average crossover, whatever you use) to determine which side of the move to catch.
You can also use ATR to compare volatility across instruments and choose where to allocate your attention. Check ATR across your watchlist at the start of each session. Pairs with rising ATR are showing life. Pairs with flat or declining ATR are sleeping. Focus your analysis and capital on the active pairs. This seems obvious, but the number of traders who spend an hour analyzing a pair that's barely moving, only to get frustrated by choppy price action, is staggering.
One more practical application: ATR as a profit target estimator. If the daily ATR is 80 pips and you're expecting a trade to reach its target within one day, setting a 120-pip target is asking the pair to move 50% more than its average daily range. Not impossible, but statistically unlikely unless there's a major catalyst. A more realistic daily target might be 0.5x to 0.75x the daily ATR. On the H4 chart, expect roughly one ATR of movement per bar as a reasonable expectation. Calibrating your take-profit to what the instrument actually does — rather than what you wish it would do — is another way ATR keeps your expectations grounded in reality.

Low ATR means the market's hibernating - time to wait for volatility to wake up.
“You've entered a trade, it's moving in your direction, and now you face the eternal dilemma: when do you take profit? Too early and you leave money on the table during strong trends.”
5ATR Trailing Stop: The Chandelier Exit Method
You've entered a trade, it's moving in your direction, and now you face the eternal dilemma: when do you take profit? Too early and you leave money on the table during strong trends. Too late and you watch open profits evaporate as the trend reverses. The Chandelier Exit, developed by Charles Le Beau and popularized by Alexander Elder in his book "Come Into My Trading Room," solves this elegantly using ATR.
The name comes from how the stop hangs down from the highest point of the trade — like a chandelier from a ceiling. The formula for a long trade: Trailing Stop = Highest High (over N periods) - (ATR x Multiplier). For shorts: Trailing Stop = Lowest Low (over N periods) + (ATR x Multiplier).
The default parameters are a 22-period lookback and a 3x ATR multiplier. The 22-period window captures roughly one month of trading days, and the 3x multiplier provides enough distance to survive deep pullbacks within a trend while still locking in profit if the trend genuinely reverses.
Here's how it works in practice. Say you're long Gold on the daily chart. Price has rallied from $2,200 to $2,350 over the past three weeks. The 22-period highest high is $2,350. The current 22-period ATR is $32. Your Chandelier Exit sits at: $2,350 - ($32 x 3) = $2,254. As long as price stays above $2,254, you hold the position. If Gold pulls back to $2,310 — a normal retracement within a healthy trend — you're still in. The ATR-based buffer absorbed that pullback.
Now price pushes to a new high at $2,385. Your Chandelier Exit immediately adjusts upward: $2,385 - ($32 x 3) = $2,289. You've locked in an additional 35 points of profit without doing anything. The stop only moves up — never down. Every new high ratchets the exit higher, and the ATR multiplier ensures you're always giving the trend exactly as much room as current volatility demands.
The beauty of this system is what happens when the trend ends. Price makes one last high at $2,400, ATR is $34, so the exit sits at $2,400 - ($34 x 3) = $2,298. Price then rolls over, drops through $2,350, $2,320, and hits your stop at $2,298. You captured the bulk of a $200 move. You didn't need to predict the top. You didn't need to watch a news feed for reversal catalysts. The math took care of it.
Adjusting the parameters changes the personality of the stop. A smaller multiplier (2x instead of 3x) creates a tighter trailing stop that captures less of each trend but exits earlier when reversals begin — better for swing traders holding positions for days. A larger multiplier (4x or 5x) lets you ride long-duration trends across weeks or months but gives back more profit at the end — better for position traders and trend-followers who prioritize catching major moves.
The lookback period matters too. A shorter lookback (10-15 periods) makes the stop respond faster to recent price action, while a longer lookback (20-30 periods) creates a more stable reference point. For most forex traders on the H4 or D1 timeframe, the defaults of 22 and 3x work well without modification.
One important distinction: the Chandelier Exit is a stop management tool, not an entry signal. Its job is to tell you when to get out of a winning trade — not when to get in. Entry signals should come from your primary strategy (breakouts, pullbacks, pattern recognition, whatever you use). Once you're in a trade and it's moving in your favor, that's when you switch to the Chandelier Exit for trailing your stop.
A simplified version that many traders use on MetaTrader: instead of the full Chandelier formula, just trail your stop by subtracting 2x ATR from the current bar's high for longs (or adding 2x ATR to the current bar's low for shorts), updating every time a new bar closes. This isn't technically the Chandelier Exit — it doesn't use the N-period highest high — but it captures the same idea of an ATR-based trailing stop and is much simpler to implement manually.
The psychological benefit is worth mentioning. Without a systematic trailing stop, traders face constant temptation to close winning trades too early. Every red candle in a pullback triggers the fear of giving back profits. The Chandelier Exit removes that emotional burden by providing a clear, mathematically defined line. Above the line? Hold. Below the line? Exit. No second-guessing required. For traders who struggle with taking profits (which, honestly, is most of us), that clarity alone is worth the price of admission.
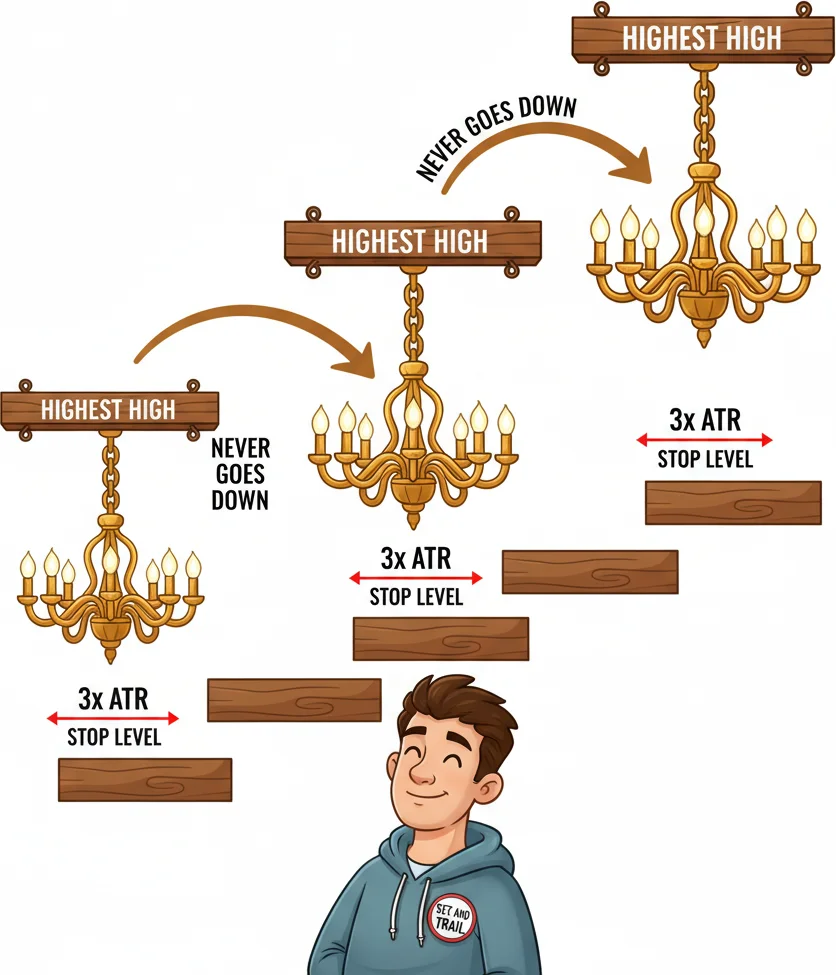
The Chandelier Exit hangs your stop from the highest high — like a chandelier dangling from the ceiling of the trend.
Frequently Asked Questions
Q1What is the best ATR period setting for day trading versus swing trading?
For day trading on M15 to H1 charts, the default 14-period works well and captures roughly half a session to a full session of volatility data. Some scalpers prefer a shorter 7-period for faster reaction to intraday volatility shifts. For swing trading on H4 to D1, stick with 14 or extend to 20 for smoother readings that filter out single-session noise. The key principle: shorter periods react faster but are noisier, longer periods are smoother but slower to reflect volatility changes.
Q2Does ATR work for crypto and stocks, or only forex?
ATR works on any liquid market. The formula is purely mathematical and makes no assumptions about the asset class. In fact, ATR is especially valuable for crypto and stocks because these markets gap frequently between sessions — exactly the scenario Wilder designed the True Range calculation to capture. Just be aware that ATR values are in the instrument's price units, so a Bitcoin ATR of 1,500 means average movement of $1,500 per bar, while a EUR/USD ATR of 0.0020 means 20 pips.
Q3Can ATR tell me whether the market is going up or down?
No, and that is by design. ATR measures volatility — the magnitude of price movement — regardless of direction. A rising ATR means price is moving more aggressively, which could be a strong rally or a sharp sell-off. A falling ATR means price is calming down. You need a separate directional indicator like a moving average, MACD, or simple price action analysis to determine the trend direction. ATR handles the risk side of your trading; direction comes from other tools.
Q4How often should I recalculate my ATR-based stop loss?
Calculate your stop loss once at entry and leave it in place. Do not recalculate mid-trade as ATR fluctuates — doing so leads to constant tinkering that undermines your risk plan. The one exception is if you are using an ATR trailing stop like the Chandelier Exit, where the stop systematically moves in your favor as the trade progresses. In that case, update the trailing stop each time a new bar closes, but never move it further from your entry than where it previously sat.
Q5What ATR multiplier should I use for my stop loss — 1.5x, 2x, or 3x?
It depends on your holding period and timeframe. For intraday trades on H1 or lower, 1.0x to 1.5x ATR keeps stops tight while filtering most noise. For multi-day swing trades on H4 to D1, 2.0x to 2.5x ATR gives enough room for overnight gaps and deeper retracements. For position trades and trend-following systems on D1 or higher, 3.0x ATR is the standard starting point. The guiding principle is to backtest your multiplier on at least 50-100 historical trades for your specific instrument and timeframe before committing real capital.
Top Brokers
About the Author
Daniel Harrington
Senior Trading Analyst
Daniel Harrington is a Senior Trading Analyst with a MScF (Master of Science in Finance) specializing in quantitative asset and risk management. With over 12 years of experience in forex and derivatives markets, he covers MT5 platform optimization, algorithmic trading strategies, and practical insights for retail traders.
Use This Indicator
Risk Disclaimer
Trading financial instruments carries significant risk and may not be suitable for all investors. Past performance does not guarantee future results. This content is for educational purposes only and should not be considered investment advice. Always conduct your own research before trading.