Double Exponential Moving Average (DEMA): Settings, Strategy & EMA Comparison
DEMA reduces lag by applying a double smoothing technique using two EMAs, resulting in faster trend detection.

Daniel Harrington
Senior Trading Analyst · MT5 Specialist
☕ 13 min read
Settings — DEMA
| Category | trend |
| Default Period | 20 |
| Best Timeframes | M15, H1, H4 |
Here's a question that haunted traders for decades: why does your moving average always seem to tell you about a trend after it's already halfway done? In 1994, a guy named Patrick Mulloy asked the same thing — and his answer changed how thousands of traders read charts. The Double Exponential Moving Average, or DEMA, was his solution: a moving average that hugs price action tighter than anything before it, giving you signals while they still matter. But is faster always better? Not exactly. DEMA has real strengths and real blind spots, and knowing the difference is what separates the traders who profit from it and the ones who get chopped up. Let's break it all down.
Key Takeaways
- Every moving average has a dirty little secret: it's late. By the time a standard Simple Moving Average (SMA) or even an...
- Let's be honest about this comparison, because too many indicator guides just tell you DEMA is "better" and leave it at ...
- Now let's get practical. The DEMA crossover is one of the most straightforward trend-following strategies you can build,...
1Patrick Mulloy's Big Idea: Killing the Lag
Every moving average has a dirty little secret: it's late. By the time a standard Simple Moving Average (SMA) or even an Exponential Moving Average (EMA) curves upward to confirm a trend, you've already missed the first chunk of the move. That lag isn't a bug — it's baked into the math. Averaging past prices means you're always looking in the rearview mirror.
Patrick Mulloy understood this problem intimately. A technical analyst and researcher, he published his solution in the January 1994 issue of Technical Analysis of Stocks & Commodities magazine. His article introduced two new indicators at once: the Double Exponential Moving Average (DEMA) and the Triple Exponential Moving Average (TEMA). Both aimed at the same enemy — lag — but DEMA became the more widely adopted of the two.
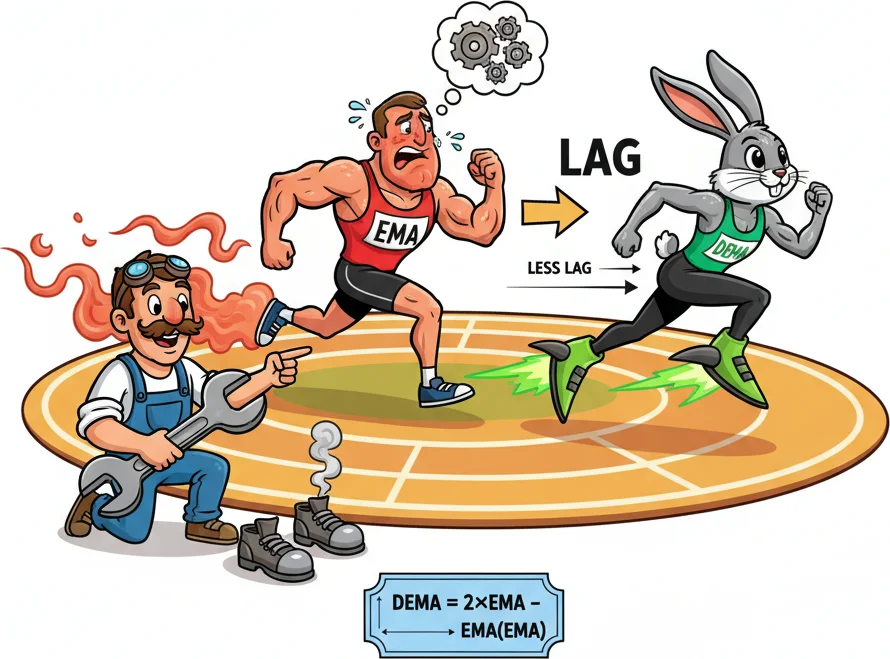
So how does it work? The name "Double Exponential" is a bit misleading. DEMA is not simply an EMA applied twice, and it doesn't have double the lag. Instead, Mulloy used a clever mathematical trick. He took a standard EMA, doubled its value, and then subtracted the EMA of that EMA. The formula looks like this:
DEMA = (2 x EMA) - EMA(EMA)
Where EMA is the Exponential Moving Average of price, and EMA(EMA) is the Exponential Moving Average applied to the first EMA's output. That subtraction step is the key — it cancels out much of the smoothing delay that makes traditional moving averages sluggish.
As Mulloy himself described it, the DEMA is a composite implementation of single and double EMAs that produces another EMA with less lag than either of the original two. The result is a line that tracks price more closely, turns faster at reversals, and gives crossover signals earlier than a standard EMA with the same period setting.
One technical detail worth knowing: because the formula uses an EMA of an EMA, DEMA needs more data points to start producing values. Specifically, it requires (2 x period - 1) bars of data before the first valid reading appears. For a 20-period DEMA, that's 39 bars. This is slightly more than the 20 bars a regular EMA needs, but it's a minor trade-off for the responsiveness you gain.
Mulloy's work didn't just create a faster indicator — it opened the door to a whole category of reduced-lag moving averages. After DEMA and TEMA, other analysts developed indicators like the Kaufman Adaptive Moving Average (KAMA) and the Hull Moving Average (HMA), all chasing that same goal of getting closer to real-time price action without drowning in noise. But DEMA remains one of the most elegant solutions: simple formula, easy to understand, and built into most modern trading platforms including MetaTrader 5.
Mulloy is trick: take an EMA, subtract the lag by applying EMA again, and you get a line that hugs price tighter.
2DEMA vs EMA: Is Double Really Better?
Let's be honest about this comparison, because too many indicator guides just tell you DEMA is "better" and leave it at that. The truth is more nuanced.
Pull up any chart and overlay a 20-period EMA and a 20-period DEMA on the same timeframe. The first thing you'll notice is that DEMA clings to price bars more tightly. When price makes a sharp move, DEMA follows faster. When price reverses, DEMA turns sooner. The EMA, by comparison, traces a smoother, more gradual curve that lags behind.
This difference becomes dramatic at turning points. Imagine EUR/USD has been trending up on the H4 chart and suddenly reverses. The 20-period DEMA will curl downward noticeably earlier than the 20-period EMA. For a crossover-based system, this means your sell signal arrives sooner — potentially saving you from giving back several candles' worth of profit.
Here's a concrete example of the lag difference. When price crosses below the moving average during a reversal, DEMA typically signals the cross 2-4 bars earlier than a standard EMA on the same period. On an H4 chart, that's 8-16 hours of earlier notification. On a daily chart, it could mean getting in days ahead of slower traders still watching their regular EMAs.
But here's where it gets interesting — and where blind DEMA enthusiasm falls apart.
The noise problem. That same responsiveness that gives you earlier signals in trends also makes DEMA jumpier during consolidation. In a sideways, choppy market, DEMA will whip above and below price more frequently than EMA. Each of those whips looks like a signal. Most of them are traps. A standard EMA, being smoother, filters out some of that noise naturally.
The smoothness trade-off. If you use moving averages to identify the overall trend direction (not just for crossover signals), EMA's smoother curve can actually be more useful. DEMA's tight tracking of price can make it harder to see the forest for the trees. You might watch DEMA flattening and think the trend is weakening, when really price is just taking a brief pause before continuing.
When DEMA wins: Trending markets, breakout situations, fast-moving pairs like GBP/JPY or gold, and shorter timeframes (M15, H1) where getting in early matters most. DEMA also shines in strategies where you use the moving average as a dynamic support/resistance level — its tighter fit to price means it acts as a more responsive barrier.
When EMA wins: Ranging markets, longer-term position trading, and situations where you want a cleaner trend filter with fewer false signals. If you're a swing trader who holds positions for weeks, the few extra bars of lag from an EMA rarely matter, and the smoother line helps you stay in trades longer.
The verdict? DEMA isn't universally better than EMA. It's better for specific situations — mainly short-to-medium-term trading in trending conditions. Think of it this way: DEMA is the sports car and EMA is the sedan. The sports car is faster, but that doesn't make it the right choice for every road.

DEMA's speed advantage - cutting lag while EMA is still catching up!
“Now let's get practical.”
3The DEMA Crossover System for Swing Trading
Now let's get practical. The DEMA crossover is one of the most straightforward trend-following strategies you can build, and it works particularly well on H4 and Daily timeframes for swing trading.
The setup uses two DEMA lines with different periods: a fast one and a slow one. The classic combination is a 21-period DEMA (fast) and a 55-period DEMA (slow). Some traders prefer 20/50 or 34/55 — the exact numbers matter less than maintaining a reasonable gap between them.
Entry rules are simple:
Long entry: When the fast DEMA (21) crosses above the slow DEMA (55), this signals bullish momentum building. Enter a buy position on the close of the candle that confirms the crossover.
Short entry: When the fast DEMA (21) crosses below the slow DEMA (55), this signals bearish momentum. Enter a sell position on the close of the confirmation candle.
Stop loss placement: Place your stop loss below the most recent swing low (for longs) or above the most recent swing high (for shorts). Alternatively, use the slow DEMA line itself as a trailing stop — as long as price stays on the right side of the 55-period DEMA, you hold the position.
Take profit approach: There are two schools of thought here. The first is to use a fixed risk-reward ratio (1:2 or 1:3). The second — and often more profitable in strong trends — is to ride the trend until the fast DEMA crosses back over the slow DEMA in the opposite direction. This exit signal keeps you in the trade during extended moves.
Adding a confirmation filter:
Here's what separates a basic crossover system from a reliable one: confirmation. The DEMA crossover alone will generate whipsaws in flat markets. To filter these out, add one of these:
ADX filter: Only take crossover signals when the Average Directional Index (ADX) reads above 25. This confirms that the market actually has enough trend strength to sustain the move. Below 25, the market is likely ranging, and crossovers are probably noise.
Volume confirmation: If the crossover candle has above-average volume, the signal is stronger. Low-volume crossovers are more likely to fail.
RSI context: Check the Relative Strength Index. For long signals, RSI should ideally be above 50 but below 70 (confirming momentum without being overbought). For shorts, RSI below 50 but above 30.
Timeframe considerations:
On the H4 chart, the 21/55 DEMA crossover generates roughly 2-4 signals per month on major forex pairs. This is a manageable frequency for swing traders who don't want to monitor charts constantly. On the Daily chart, expect fewer signals — maybe 1-2 per month — but each signal tends to capture larger moves.
Avoid using this system on timeframes below M30. The crossover generates too many signals on lower timeframes, and transaction costs eat into profits quickly.
A real-world application:
Consider applying this to a trending pair like USD/JPY on the H4 chart. During strong directional moves driven by interest rate differentials, the 21/55 DEMA crossover does an excellent job of catching the trend early and keeping you in. The fast DEMA responds to the momentum shift while the slow DEMA confirms the underlying direction. When both are angled the same way and separated by a widening gap, you know the trend has legs.
The key discipline: accept that not every crossover will be a winner. Expect a win rate around 40-50% — the strategy profits because winners are significantly larger than losers when trends develop, not because it picks the right direction most of the time.
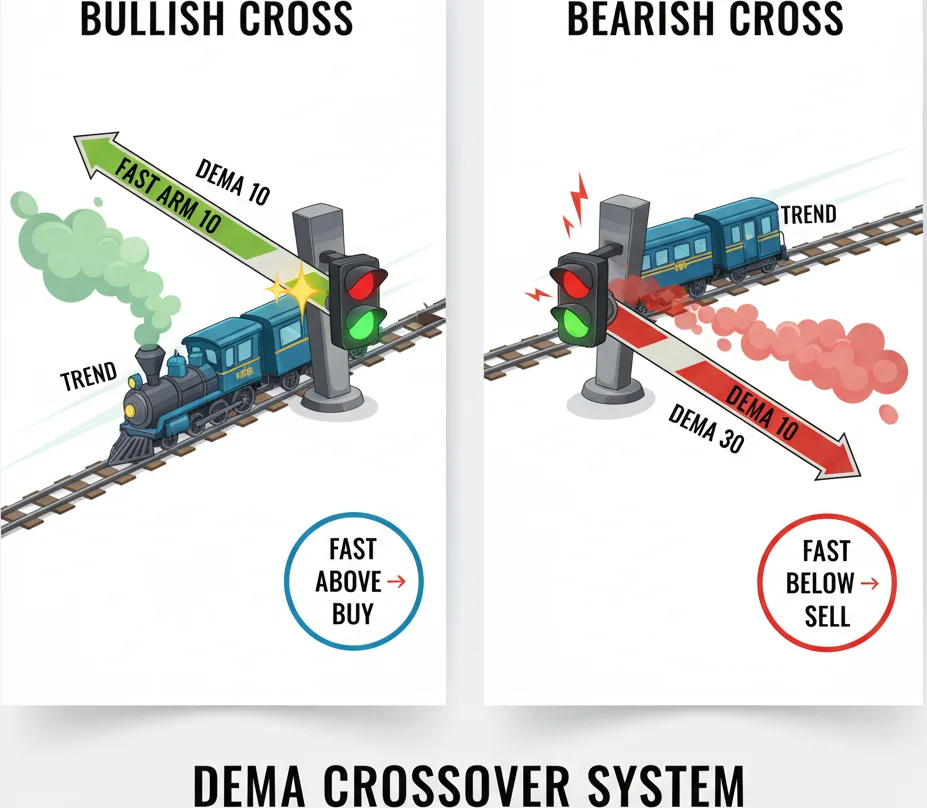
Fast DEMA crosses above slow DEMA? Trend is up. Crosses below? Trend flipped. Classic crossover, faster execution.
4Where DEMA Falls Apart: Choppy Markets and Whipsaws
Let's talk about DEMA's dark side, because every indicator has one, and ignoring it is how traders lose money.
The core problem is simple: DEMA's speed is both its greatest strength and its biggest vulnerability. In a trending market, getting signals 2-4 bars early is fantastic. In a ranging market, those same early signals turn into a rapid-fire sequence of false alerts that drain your account through death by a thousand paper cuts.
The choppy market nightmare:
Picture EUR/CHF stuck in a 60-pip range for two weeks. Price bounces between support and resistance with no real direction. During this time, a 20-period DEMA will cross above and below price repeatedly — sometimes multiple times per day on the H1 chart. Each cross looks like a potential breakout. None of them are. If you're trading every DEMA signal mechanically, you'll take 8-10 losing trades before the range finally breaks (if it even breaks in your direction).
A standard EMA would generate fewer of these false signals because its smoother curve doesn't react as aggressively to minor price fluctuations within the range. This is the fundamental trade-off: DEMA's responsiveness, which you love in trends, becomes noise sensitivity in ranges.
The low-volatility trap:
DEMA also struggles during periods of genuinely low volatility — think holiday weeks, the hours between the New York close and the Asian open, or those dead-quiet periods before major central bank announcements. During these times, price action is thin and erratic. DEMA picks up every little twitch and presents it as meaningful movement. It's like having a smoke detector that goes off every time you make toast.
News spike distortion:
When a major economic release hits — Non-Farm Payrolls, CPI data, central bank rate decisions — price can spike violently in one direction and then reverse equally fast. DEMA reacts to the initial spike immediately, potentially triggering a signal. But if price reverses within minutes, you're stuck in a losing trade based on a move that was over almost as soon as it started. The faster response time that helps in normal conditions actually hurts you here.
When you should NOT use DEMA:
- When ADX is below 20. The market has no trend, and any DEMA signal is essentially random.
- During major news events. Wait for the dust to settle — at least 30-60 minutes after high-impact releases.
- On very low timeframes (M1, M5) without additional filters. The signal-to-noise ratio becomes too poor.
- On pairs known for extended ranging behavior, like EUR/CHF or AUD/NZD, unless you have strong confirmation of a breakout.
- During holiday periods with thin liquidity.
How to protect yourself:
The best defense against DEMA whipsaws is to combine it with a trend-strength indicator. The ADX is the classic choice: if ADX is below 25, you step aside. No DEMA signals get traded. Period. This single filter eliminates a huge percentage of losing trades.
Another approach is multi-timeframe analysis. Before taking a DEMA signal on H1, check the H4 or Daily chart. Is the higher timeframe DEMA pointing in the same direction? If not, skip the trade. You want the wind at your back — DEMA signals that align with the higher timeframe trend have a much better success rate than counter-trend signals.
Finally, consider using Bollinger Bands alongside DEMA. When Bollinger Bands are narrow (squeezing), the market is in low-volatility consolidation — exactly the environment where DEMA produces the most false signals. Wait for the Bands to expand before trusting DEMA crossovers.
The bottom line: DEMA is a specialized tool for trending conditions. Trying to use it in every market environment is like using a chainsaw to cut butter. Match the tool to the conditions, and it works beautifully. Force it where it doesn't belong, and you'll regret it.

When choppy markets turn your smooth DEMA signals into pure noise.
“Good news — DEMA comes pre-installed in MetaTrader 5.”
5Setting Up DEMA on MetaTrader 5: Quick Start
Good news — DEMA comes pre-installed in MetaTrader 5. You don't need to download anything or hunt for custom indicator files. Here's how to get it on your chart in under a minute.
Step 1: Open the Navigator panel.
If the Navigator isn't visible on the left side of your MT5 window, press Ctrl+N or go to View > Navigator in the top menu. You'll see a tree of folders including Indicators.
Step 2: Find DEMA.
Expand the Indicators folder, then click on Examples. You'll find DEMA listed there alphabetically. On some broker builds, it may also appear under Trend Indicators.
Step 3: Add it to your chart.
Double-click DEMA in the Navigator, or drag and drop it onto your price chart. A settings dialog will appear.
Step 4: Configure the parameters.
The settings dialog has several tabs. Here's what matters:
Inputs tab:
- InpPeriodEMA — This is the lookback period. The default is 14. For swing trading, change this to 20 or 21. For a crossover system, you'll add DEMA twice with different periods (e.g., 21 and 55).
- InpShift — Shifts the indicator forward or backward on the chart. Leave this at 0 unless you have a specific reason to offset it.
Colors tab:
- Change the line color to something visible against your chart background. The default DarkBlue can be hard to see on dark chart themes. A bright color like orange or lime green works well.
- Adjust the line width. The default is 1, but bumping it to 2 makes the line easier to read at a glance.
Levels tab:
- You can skip this for DEMA. It's more relevant for oscillators.
Click OK, and the DEMA line appears on your chart.
Setting up a dual-DEMA crossover system:
Repeat Steps 2-4 twice — once for your fast DEMA (period 21) and once for your slow DEMA (period 55). Use different colors for each line so you can tell them apart instantly. A common choice is a warm color (red or orange) for the fast line and a cool color (blue or teal) for the slow line.
Recommended settings by trading style:
- Scalping (M5-M15): 9-period DEMA. Extremely responsive, requires quick decision-making.
- Day trading (M15-H1): 20-period DEMA. A solid balance of speed and reliability.
- Swing trading (H4-D1): 21/55 DEMA crossover system. Fewer signals, larger moves.
- Trend identification (D1-W1): 50-period DEMA. Slower but cleaner trend direction.
Saving your setup as a template:
Once you've configured DEMA the way you like it, right-click on the chart and select Template > Save Template. Give it a descriptive name like "DEMA_Crossover_H4." Next time you open a new chart, just load the template and all your indicator settings apply instantly.
Quick tip for applied price:
DEMA calculates on closing prices by default (PRICE_CLOSE), which works well for most strategies. Some traders experiment with applying DEMA to the median price ((High + Low) / 2) or typical price ((High + Low + Close) / 3) for a slightly smoother reading. You can change this in the indicator's code if needed, though for most traders the default close price is perfectly fine.
That's it — you're ready to start analyzing with DEMA. The whole setup takes less time than making a cup of coffee, which, come to think of it, you should probably go make before your next trading session.

MT5 does not have DEMA built-in — but installing it takes 60 seconds with the right custom indicator file.
Frequently Asked Questions
Q1What is the best period setting for DEMA?
There's no single best period — it depends on your trading style. For scalping on M5-M15, a 9-period DEMA gives the fastest response. For day trading on M15-H1, the 20-period is the most popular balance of speed and smoothness. Swing traders on H4-D1 typically use a 21/55 DEMA crossover system. Longer-term traders may prefer a 50-period DEMA for cleaner trend identification. Start with the 20-period default and adjust based on how many signals you're getting and how many turn out to be false.
Q2Is DEMA better than EMA for forex trading?
DEMA is better than EMA in specific conditions — mainly trending markets and shorter timeframes where reduced lag gives you a meaningful timing advantage. In choppy, sideways markets, EMA often performs better because its smoother line produces fewer false signals. For most forex traders, the best approach is to use DEMA when the market is clearly trending (ADX above 25) and switch to EMA or step aside when conditions turn range-bound.
Q3Can I use DEMA as a standalone indicator?
You can, but you probably shouldn't. DEMA alone will give you too many false signals during consolidation periods. Most successful DEMA traders combine it with at least one confirmation tool — the ADX for trend strength, RSI for momentum context, or volume analysis to validate crossover signals. Multi-timeframe analysis also helps enormously: check that the higher timeframe DEMA agrees with your signal before entering.
Q4How is DEMA different from TEMA?
Both DEMA and TEMA were created by Patrick Mulloy in the same 1994 article. DEMA uses the formula (2 x EMA) - EMA(EMA), while TEMA adds another layer: (3 x EMA) - (3 x EMA(EMA)) + EMA(EMA(EMA)). TEMA is even more responsive than DEMA and clings to price even tighter, but it's also more prone to whipsaws. Think of it as a spectrum: SMA is the slowest, then EMA, then DEMA, then TEMA. Each step gains speed but loses smoothness.
Q5Why does my DEMA line start later than my EMA on the chart?
This is normal behavior, not a bug. Because DEMA calculates an EMA of an EMA, it needs more historical data before it can produce its first value. Specifically, a DEMA with period N requires (2N - 1) bars of data. So a 20-period DEMA needs 39 bars before it appears, compared to just 20 bars for a standard EMA. This only affects the very beginning of your chart and has no impact on current signals.
Top Brokers
About the Author
Daniel Harrington
Senior Trading Analyst
Daniel Harrington is a Senior Trading Analyst with a MScF (Master of Science in Finance) specializing in quantitative asset and risk management. With over 12 years of experience in forex and derivatives markets, he covers MT5 platform optimization, algorithmic trading strategies, and practical insights for retail traders.
Use This Indicator
Risk Disclaimer
Trading financial instruments carries significant risk and may not be suitable for all investors. Past performance does not guarantee future results. This content is for educational purposes only and should not be considered investment advice. Always conduct your own research before trading.