Donchian Channel Indicator: Richard Donchian's Trend-Following Breakout System
Donchian Channel plots the highest high and lowest low over a specified period, identifying breakouts and establishing support/resistance levels.

Daniel Harrington
Senior Trading Analyst · MT5 Specialist
☕ 17 min read
Settings — DC
| Category | volatility |
| Default Period | 20 |
| Best Timeframes | H1, H4, D1 |
Some indicators try to predict the future. The Donchian Channel just draws a box around the recent past and waits for price to break out of it. Developed by Richard Donchian in the 1950s, this three-line channel plots the highest high and lowest low over a set number of periods, with a midline splitting the difference. It became the backbone of the most famous trading experiment ever conducted — the Turtle Traders — and remains one of the cleanest breakout tools available in MetaTrader 5 today. The default setting is 20 periods, roughly one trading month, and the logic could not be simpler: if price pushes above the upper band, buyers are in control. If it drops below the lower band, sellers have taken over. Everything in between is just noise waiting to resolve.
Key Takeaways
- Richard Davoud Donchian was born in Hartford, Connecticut in 1905 to Armenian immigrant parents. He graduated from Yale ...
- If you can find the highest and lowest numbers in a list, you can calculate the Donchian Channel. That is not an exagger...
- In 1983, two successful commodity traders — Richard Dennis and William Eckhardt — had a disagreement. Dennis believed th...
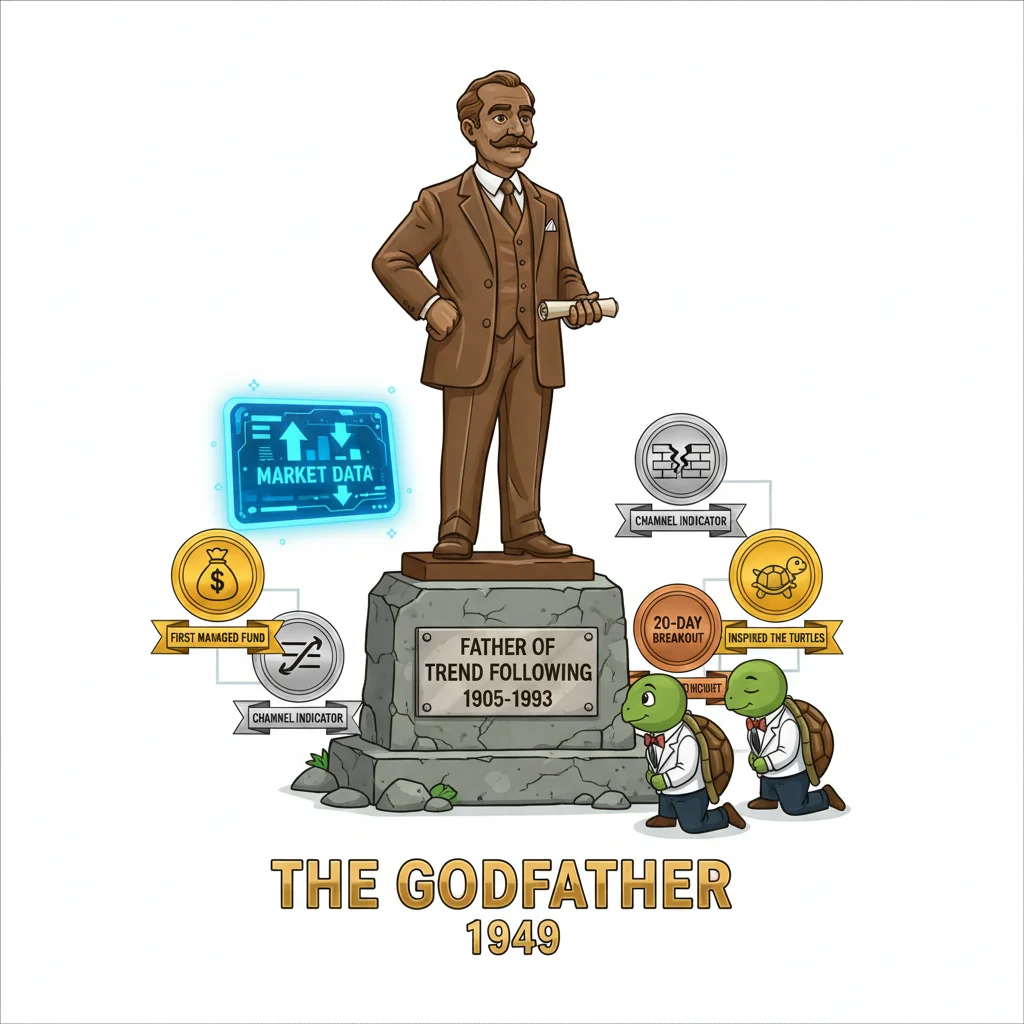
1Richard Donchian: The Father of Trend Following
Richard Davoud Donchian was born in Hartford, Connecticut in 1905 to Armenian immigrant parents. He graduated from Yale University in 1928 with a degree in economics, and almost immediately got a brutal education in market reality. The 1929 crash cost him money, but more importantly, it cost him any illusion that fundamental analysis alone could protect a portfolio. He turned to studying price action and never looked back.
Donchian started on Wall Street in the 1930s, working as a securities analyst while also running his father's Oriental rug business on the side. After serving in World War II — including the invasion of Sicily and a Pentagon posting as an Air Force statistical officer — he returned to markets with a fresh perspective. In 1948 he shifted his focus from stocks to commodities, and in 1949 he launched Futures Inc., one of the first publicly held commodity funds in the United States. The fund was built on a then-radical idea: diversification across multiple futures markets.
What made Donchian genuinely revolutionary was not a single indicator but an entire philosophy. He believed that commodity prices moved in extended sweeps — long trending moves punctuated by corrections — and that a systematic, rules-based approach could capture those moves without requiring prediction or intuition. He called this approach trend following, and he spent the next four decades refining it.
His weekly newsletter, Commodity Trend Timing, ran for 19 years and reached a circulation of roughly 10,000 copies per week. In it, he published his 5-day and 20-day moving average crossover system and the channel breakout rules that would eventually carry his name. In 1960, he joined Hayden Stone as Director of Commodity Research, later moving through the firm's successors until he became a Vice President at Shearson Lehman Brothers.
The numbers speak for themselves. Over the course of his career, Donchian reportedly turned $200,000 into $18 million — not through one spectacular year, but through decades of disciplined trend following. He faced drawdowns along the way, which he accepted as the cost of doing business. In 1983, he received the first-ever Most Valuable Performer Award from Managed Accounts Report for his contributions to commodity money management.
Donchian passed away in April 1993, but his influence runs through virtually every trend-following system in use today. Richard Dennis, who would go on to create the Turtle Trading experiment, built directly on Donchian's work. The channel indicator that bears his name is perhaps the simplest of his contributions, but it captures the core of his philosophy: do not predict where price will go. Wait for it to tell you, then follow.
The Donchian Channel itself crystallized in the 1950s as a visual representation of these ideas. Rather than using complex statistical calculations, Donchian asked one straightforward question: what is the highest high and the lowest low over the past N periods? If price exceeded the highest high, a new uptrend was likely underway. If it broke the lowest low, a downtrend had begun. No moving averages, no standard deviations, no smoothing functions. Just raw price extremes.
This simplicity was deliberate. Donchian had seen enough traders overfit their analysis to past data and blow up when markets shifted. He wanted a system that worked because it captured a fundamental truth about markets: breakouts to new highs or lows carry information about the balance of supply and demand. That information does not require a PhD to interpret.
Donchian started trend following before most traders were born. His channels are the DNA of the Turtle system.
2The Simplest Channel Ever: Highest High and Lowest Low
If you can find the highest and lowest numbers in a list, you can calculate the Donchian Channel. That is not an exaggeration. The math behind this indicator is genuinely that simple, which is part of what makes it effective — there is nothing to overfit, nothing to curve-fit, and nothing to misunderstand.
The Donchian Channel consists of three lines:
Upper Band = Highest High over the last N periods Lower Band = Lowest Low over the last N periods Middle Line = (Upper Band + Lower Band) / 2
The default value for N is 20 periods. On a daily chart, that covers roughly one trading month. On H4, it covers about 13 trading days. On a weekly chart, it represents nearly five months of price history.
Here is a concrete example. Suppose you are looking at EUR/USD on the daily chart. Over the past 20 trading days, the highest high was 1.0950 and the lowest low was 1.0780. The Donchian Channel plots:
- Upper Band: 1.0950
- Lower Band: 1.0780
- Middle Line: 1.0865
That is the entire calculation. No weighted averages, no exponential smoothing, no standard deviation multipliers. Tomorrow, the channel recalculates by looking at the most recent 20 days, which means the oldest day drops off the window and today's data enters it.
This creates a distinctive visual pattern on the chart. The upper and lower bands move in a staircase fashion — they stay flat until a new high or low is printed, then jump to the new level. Unlike Bollinger Bands, which expand and contract smoothly with volatility, Donchian bands move in discrete steps. A flat upper band means price has not exceeded its 20-period high. A rising upper band means a new high just occurred.
The width of the channel tells you about volatility. When the upper and lower bands are far apart, the market has seen a wide price range over the lookback period. When the bands are close together, price has been contained in a narrow range — a compression that often precedes a breakout. Experienced traders watch for channel narrowing as a setup indicator and then trade the direction of the eventual breakout.
Reading the Signals
The primary signals are straightforward:
- Breakout above the upper band: Price has exceeded the highest point of the past 20 periods. This suggests buyers are pushing into new territory and an uptrend may be starting or continuing. Traditional interpretation: go long.
- Breakout below the lower band: Price has dropped below the lowest point of the past 20 periods. Sellers are in control. Traditional interpretation: go short.
- Price near the middle line: The market is in no-man's land, midway between recent extremes. No strong signal.
The middle line also serves as a trailing stop reference. A common approach is to enter long on an upper band breakout and exit when price drops back to the middle line, or to enter short on a lower band breakout and exit when price rises back to the middle line. This captures the meat of the trend while avoiding the drawdown of holding through a full reversal.
In MetaTrader 5
The Donchian Channel is not included as a default indicator in MT5, but it is available as a free custom indicator from the MQL5 marketplace. Once installed, you will find it under Insert, then Indicators, then Custom. The only parameter you typically need to adjust is the period, which defaults to 20. Some enhanced versions offer multi-timeframe display, alert systems, and optional Fibonacci levels within the channel.
Period Selection Guidelines
The 20-period default works well for swing trading on H4 and D1. For shorter-term approaches, 10 periods provide faster signals but more false breakouts. For position trading on D1 and W1, 50 or 55 periods (the Turtle system's long-term setting) filter out minor fluctuations and focus only on major trend changes.
A useful rule of thumb: the period should be long enough that a breakout above or below the channel feels meaningful. If the channel is so tight that price touches the bands constantly, the period is too short for that timeframe. If price never reaches the bands, the period is too long. For most forex pairs on H4, 20 periods hits the sweet spot.
Why Simplicity Works Here
Traders sometimes dismiss the Donchian Channel as too basic compared to Bollinger Bands or other statistical channel indicators. But simplicity is not a weakness — it is the point. The channel makes no assumptions about the distribution of returns, uses no lagging smoothing functions, and requires no parameter optimization. It answers a single question: has price reached a level it has not seen in N periods? That binary signal, while crude, captures something fundamental about market structure that more complex indicators sometimes obscure with their additional calculations.

Donchian channels: the smoothest way to find breakouts since 1970
“In 1983, two successful commodity traders — Richard Dennis and William Eckhardt — had a disagreement.”
3The Turtle Trading Rules: Donchian's Most Famous Strategy
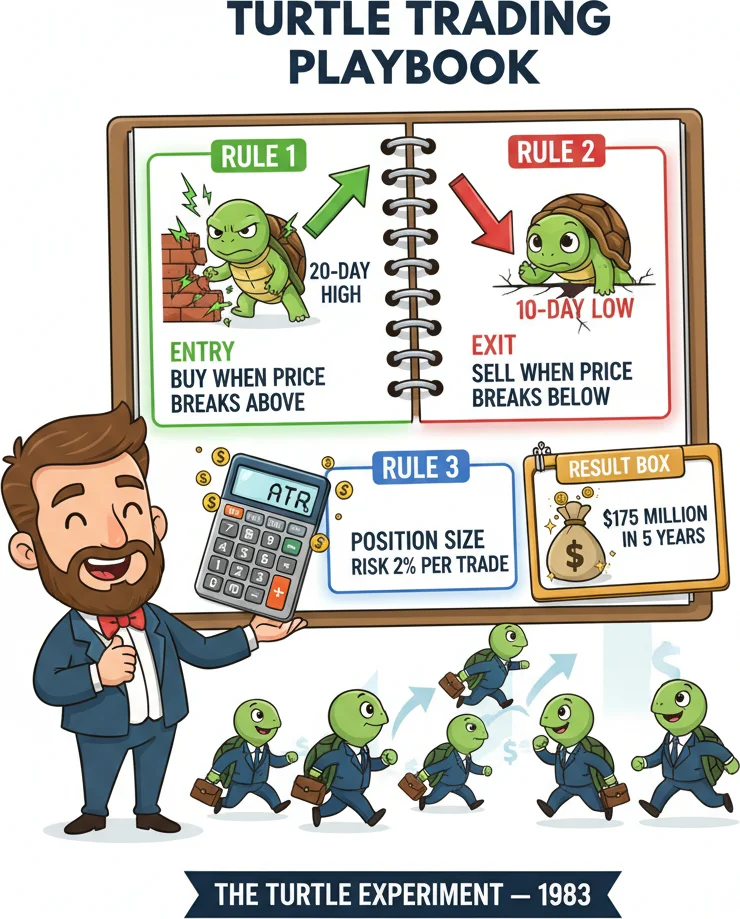
In 1983, two successful commodity traders — Richard Dennis and William Eckhardt — had a disagreement. Dennis believed that trading could be taught to anyone. Eckhardt argued that successful traders were born with an innate ability. To settle the debate, they ran an experiment that would become the most famous in trading history.
Dennis recruited 23 people with no professional trading experience, trained them for two weeks in a specific set of rules, gave them real money to trade, and turned them loose on the futures markets. He called them the Turtles, reportedly inspired by turtle farms he had visited in Singapore. Over the next five years, the Turtles generated approximately $175 million in profit.
The backbone of the Turtle system was the Donchian Channel.
System 1: The 20-Day Breakout
The first system used a 20-period Donchian Channel. The entry rules were mechanical:
- Buy when price exceeds the 20-day highest high by even a single tick.
- Sell short when price drops below the 20-day lowest low by even a single tick.
There was one critical filter: if the previous 20-day breakout signal had been profitable, System 1 skipped the current signal. The reasoning was that after a winning breakout, the market was more likely to be extended rather than starting a fresh trend. This skip rule prevented chasing and reduced overtrading.
- Exit longs when price drops to the 10-day lowest low.
- Exit shorts when price rises to the 10-day highest high.
Notice the asymmetry: a 20-day channel for entries but a 10-day channel for exits. This design lets profits run on the longer lookback while cutting losses relatively quickly on the shorter one.
System 2: The 55-Day Breakout
System 2 used a 55-period Donchian Channel, targeting major long-term trends. Every 55-day breakout was taken regardless of previous results — there was no skip rule.
- Exit longs at the 20-day lowest low.
- Exit shorts at the 20-day highest high.
System 2 generated fewer signals and captured larger moves. It also required more patience. You might sit through weeks of flat price action waiting for a breakout that never came, then suddenly catch a multi-month commodity trend that paid for all the waiting.
Position Sizing: The N Factor
This is where the Turtle system became genuinely sophisticated. N was the 20-day Average True Range (ATR), a measure of daily volatility. The Turtles calculated their position size so that a 1-ATR move against them would cost exactly 1% of their account equity.
Unit Size = (1% of Account Equity) / (N x Dollar Value per Point)
This ensured that a volatile instrument like crude oil and a calm one like Treasury bonds carried the same risk per trade. The position sizing adapted to the market, not the other way around.
Pyramiding: Adding to Winners
The Turtles did not just enter once and hold. If a trade moved in their favor by half an N (half the ATR), they added another unit. They could add up to four units per market, each time moving the stop-loss for all units to 2N below the most recent entry.
This pyramiding approach is what turned moderate trends into massive returns. A 20% move in a commodity, with four units pyramided in, could produce returns far exceeding the underlying price movement.
Risk Management
Risk limits were strict:
- Maximum 4 units in a single market
- Maximum 10 units in closely correlated markets
- Maximum 12 units total in one direction across all markets
- For every 10% drawdown in account equity, the Turtles reduced their unit size by 20%
The stop-loss was always 2N below entry for longs (or 2N above for shorts). No exceptions, no discretion, no moving the stop because it felt wrong.
Why the Rules Were Published — And What Happened Next
After the experiment ended, the Turtle trading rules were eventually published publicly, and the system's performance declined noticeably. This is a well-documented phenomenon: once enough participants know a system's exact rules, they front-run the signals.
Does this mean the Donchian Channel breakout is dead? Not exactly. The core principle — that breakouts to new highs or lows signal the start of trends — remains valid. What changed is that the specific 20-day and 55-day parameters became crowded. Modern adaptations use different periods, add momentum filters, or apply the system on less efficient markets.
The 35% win rate might sound discouraging, but the Turtles were never trying to be right most of the time. With a 2:1 reward-to-risk ratio and disciplined position sizing, a 35% win rate is profitable. It just requires the psychological fortitude to lose more often than you win — which, as it turns out, is harder for most people than the math.
The Turtles made $175 million in 5 years using one rule: buy the 20-day high, exit the 10-day low. Donchian powered it.
4Donchian Channel for Forex: Adapting a 1970s System to Modern Markets
Richard Donchian designed his channel for commodity futures in an era when pits were noisy, execution was slow, and daily charts were the fastest timeframe anyone seriously analyzed. Forex in 2026 is a different animal: 24-hour markets, algorithmic execution, and retail traders watching M5 charts on their phones. The good news is that the Donchian Channel's underlying logic — breakouts to new highs or lows signal trend initiation — translates perfectly. The bad news is that you need a few adjustments to make it work in modern currency markets.
Why Forex is Different
Forex trades 24 hours a day, five days a week. There are no opening gaps in the traditional sense (except over weekends), which means price action is more continuous than in futures or equities. This continuity makes channel breakouts slightly more reliable because a breakout at 3 AM during the Asian session eventually gets tested during the London and New York sessions. If the breakout holds through those high-volume periods, it carries real conviction.
However, forex pairs also exhibit different trending behavior than commodities. Major pairs like EUR/USD and GBP/USD spend significant time in ranges, while commodity currencies like AUD/USD and USD/CAD tend to trend more persistently. This means the Donchian Channel works better on some pairs than others. As a general rule, pairs that respond to carry trade flows and commodity price movements — AUD/JPY, NZD/USD, USD/CAD — tend to produce cleaner Donchian breakouts than the major pairs, which are more prone to mean reversion.
Timeframe Selection
For forex applications, H4 and D1 are the optimal timeframes:
-
D1 (Daily): This is the closest analog to Donchian's original framework. A 20-period Donchian Channel on D1 captures one month of trading history. Breakouts on this timeframe are meaningful and tend to lead to multi-day trends. The false breakout rate is manageable, and the signals are infrequent enough to suit part-time traders who check charts once a day.
-
H4 (4-Hour): Each trading day produces six H4 candles. A 20-period Donchian on H4 covers about three and a half trading days. This provides more frequent signals than D1 while still filtering out intraday noise. H4 is the sweet spot for active swing traders who want the Donchian discipline without waiting weeks between signals.
-
W1 (Weekly): A 20-period weekly Donchian spans five months. Breakouts at this level are rare but powerful, often marking the beginning of macro trends driven by central bank policy shifts or economic cycles. This timeframe suits position traders with large accounts and long time horizons.
Avoid using the Donchian Channel on timeframes below H1 for forex. The indicator was designed to capture sustained directional moves, and M15 or M5 charts contain too much noise for the channel to distinguish genuine breakouts from intraday spikes.
Multi-Timeframe Strategy
The most effective modern forex adaptation uses two timeframes:
-
D1 Donchian Channel (20-period) to identify the trend direction. If price is above the middle line and trending toward the upper band, the bias is bullish. If below the middle line and pressing toward the lower band, the bias is bearish.
-
H4 Donchian Channel (20-period) for entry timing. Only take breakouts on H4 that align with the D1 direction. If D1 says bullish, only trade long on H4 upper band breakouts. Ignore H4 lower band breakouts entirely.
This filter eliminates roughly half of all signals — and those eliminated signals are precisely the ones most likely to fail, because they fight the higher timeframe trend.
Handling False Breakouts
False breakouts are the primary challenge with any channel indicator in forex. Price pokes above the upper band, triggers a buy signal, then reverses back into the channel. Several filters help:
-
Close-only breakouts: Wait for the candle to close above or below the channel. A wick through the band that closes back inside is not a breakout — it is a liquidity grab.
-
ATR buffer: Add 0.2x ATR(14) beyond the breakout level. This filters out marginal breakouts that lack follow-through momentum.
-
Momentum confirmation: Combine with RSI above 50 or MACD histogram above zero. If price breaks the channel but momentum is flat, the move is suspect.
-
Session awareness: Breakouts during the London-New York overlap (12:00-16:00 UTC) carry more weight than those during low-liquidity sessions.
Stop-Loss and Exit Strategy
Place the stop-loss at the opposite band or the middle line, depending on risk tolerance. The Donchian middle line works well as a trailing exit: as the trend progresses, the middle line rises because new highs pull the upper band up. When price closes below the middle line, momentum has weakened enough to warrant closing.
For a more patient approach, use a shorter-period Donchian Channel for exits, just as the Turtles did. Enter on the 20-period breakout, exit on a 10-period channel break in the opposite direction.

When your 1970s turtle strategy still prints money in modern forex
“All three of these indicators draw lines above and below price to create a channel.”
5Donchian vs Bollinger vs Keltner: Three Channels Compared
All three of these indicators draw lines above and below price to create a channel. They all help assess volatility and potential breakouts. But the way each one calculates those lines leads to fundamentally different behaviors, and choosing the wrong channel for your trading style can hurt more than it helps.
How Each Channel Is Built
The Donchian Channel uses raw price extremes: the highest high and lowest low over N periods. No math beyond finding the maximum and minimum values in a dataset. The middle line is a simple average of those two extremes.
Bollinger Bands use a statistical approach. The middle line is a 20-period Simple Moving Average. The upper and lower bands are set at two standard deviations above and below that SMA. Standard deviation measures how dispersed prices are around the average, so the bands widen when price volatility increases and narrow when it decreases.
Keltner Channels use a smoothed volatility measure. The middle line is a 20-period Exponential Moving Average. The upper and lower bands are set at a multiple of the Average True Range (usually 2x ATR) above and below the EMA. ATR measures the average daily price range, which makes the bands smoother and less reactive than Bollinger Bands.
| Feature | Donchian | Bollinger | Keltner |
|---|---|---|---|
| Middle Line | (High + Low) / 2 | 20 SMA | 20 EMA |
| Band Calculation | Highest High / Lowest Low | 2x Standard Deviation | 2x ATR |
| Band Movement | Steps (staircase) | Smooth, reactive | Smooth, gradual |
| Best Use | Breakout trading | Volatility analysis, reversals | Trend pullbacks |
| False Signal Behavior | Bands flat until new extreme | Bands expand rapidly on spikes | Bands adjust moderately |
Donchian: The Breakout Specialist
Donchian's strength is its binary simplicity. Price is either at a new N-period high or it is not. When you see price touch the upper band, you know for a fact that this is the highest price in 20 periods. That certainty has value. The weakness is that the channel does not distinguish between a volatile market making wild swings and a calm market slowly grinding higher. Donchian tells you what happened but not how the market got there.
Bollinger: The Volatility Reader
Bollinger Bands excel at measuring volatility itself. When the bands squeeze, a big move is coming — though the direction is unknown. When wide, volatility may be reaching exhaustion. Bollinger is better suited for mean-reversion strategies. Price touching the upper Bollinger Band might mean the move is overextended — the opposite interpretation from Donchian, where touching the upper band is a buy signal. Using one indicator's logic on the other is a common and costly mistake. The downside is that standard deviation is sensitive to outliers, so a single large candle can dramatically widen the bands.
Keltner: The Smooth Operator
Keltner Channels split the difference. The ATR-based bands provide a smooth, adaptive measure of volatility that does not overreact to single large candles. Keltner works best for pullback entries within an established trend — if price pulls back toward the lower band without breaking it, that is a buying opportunity. This pullback-entry style is a natural complement to Donchian's breakout approach.
When to Use Which
Use Donchian when you are trading breakouts on H4, D1, or W1 and want a clear, unambiguous signal that price has reached new territory. Use Bollinger when you are analyzing volatility cycles, looking for squeezes, or trading mean reversion on H1 or lower. Use Keltner when you are trading pullbacks within established trends and want smooth band behavior that does not whipsaw on news spikes.
The classic Bollinger-Keltner squeeze strategy — where Bollinger Bands contract inside Keltner Channels to signal low volatility — can be enhanced by adding a Donchian breakout as the trigger. Wait for the squeeze to form, then enter when Donchian prints a new N-period high or low. The squeeze tells you a move is coming. The Donchian breakout tells you it has started.
One honest assessment: if you are a trend follower who trades H4 and above, the Donchian Channel is probably your best single choice among the three. Its signals are the clearest, its logic is the most transparent, and it has a 70-year track record. If you are a shorter-term trader who needs volatility analysis and mean reversion, Bollinger Bands offer more versatility. Keltner occupies the middle ground — least popular of the three, but arguably the most underrated for pullback strategies.
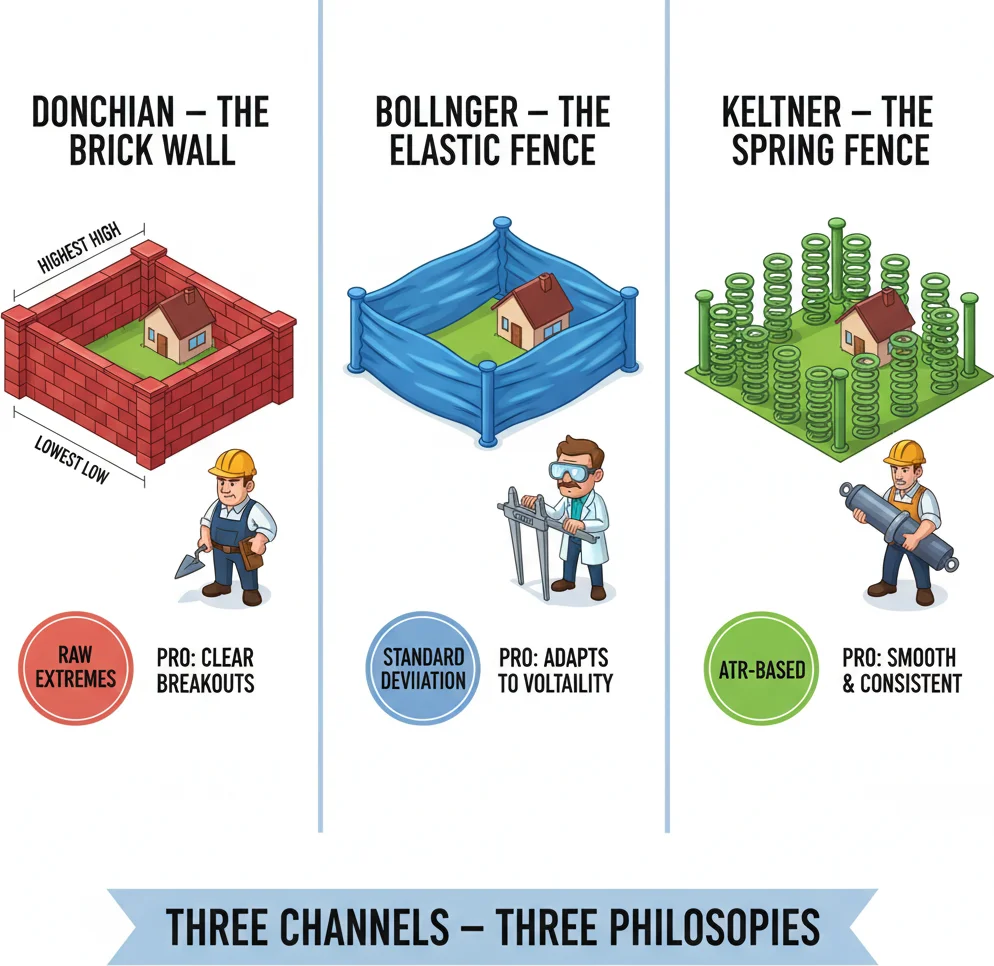
Donchian uses raw highs and lows. Bollinger uses standard deviation. Keltner uses ATR. Three philosophies of containment.
Frequently Asked Questions
Q1What is the Donchian Channel and how is it calculated?
The Donchian Channel is a trend-following volatility indicator created by Richard Donchian in the 1950s. It consists of three lines: the upper band (highest high over the last N periods), the lower band (lowest low over the last N periods), and the middle line (the average of the upper and lower bands). The default period is 20, which covers roughly one trading month on a daily chart. When price breaks above the upper band, it signals a potential uptrend. When it breaks below the lower band, it signals a potential downtrend.
Q2What is the best period setting for the Donchian Channel in forex?
The 20-period default works well for swing trading on H4 and D1 timeframes. For more responsive signals, use 10 periods, though this increases false breakouts. For position trading and catching major trends, 50 or 55 periods filters out short-term noise. The Turtle Traders used 20 for their short-term system and 55 for their long-term system. On weekly charts, even the standard 20-period setting captures five months of data, making it suitable for macro trend identification.
Q3How do I avoid false breakouts with the Donchian Channel?
Four practical filters help reduce false breakouts. First, use close-only signals — wait for the candle to close above or below the band, not just touch it intrabar. Second, add an ATR buffer (0.2x ATR) beyond the channel boundary before entering. Third, confirm with a momentum indicator like RSI above 50 for longs or below 50 for shorts. Fourth, use multi-timeframe alignment: only take H4 breakouts in the direction confirmed by the D1 Donchian Channel. Session timing also matters — breakouts during the London-New York overlap carry more weight than those during low-liquidity hours.
Q4Is the Turtle Trading strategy still profitable today?
The exact original rules with the original parameters have lost much of their edge since being publicly released, as too many participants now know and front-run those specific signals. However, the core principles — trading breakouts to new highs or lows, pyramiding into winners, using ATR-based position sizing, and cutting losses mechanically — remain sound. Modern adaptations use slightly different period settings, add momentum or volume filters, and apply the system to less efficient markets and timeframes. The 35% win rate may seem low, but with proper position sizing and a 2:1 or better reward-to-risk ratio, the math still works.
Q5What is the difference between the Donchian Channel and Bollinger Bands?
The Donchian Channel plots the absolute highest high and lowest low over a fixed number of periods, creating staircase-shaped bands that only move when a new extreme is reached. Bollinger Bands use a 20-period SMA as the center with bands set at two standard deviations, creating smoothly expanding and contracting bands that react to volatility changes. Donchian is designed for breakout trading — touching the upper band means price is at a new high, which is a buy signal. Bollinger is better for volatility analysis and mean reversion — touching the upper band may mean price is overextended and due for a pullback. Using one indicator's logic to interpret the other's signals is a common mistake.
Top Brokers
About the Author
Daniel Harrington
Senior Trading Analyst
Daniel Harrington is a Senior Trading Analyst with a MScF (Master of Science in Finance) specializing in quantitative asset and risk management. With over 12 years of experience in forex and derivatives markets, he covers MT5 platform optimization, algorithmic trading strategies, and practical insights for retail traders.
Use This Indicator
Risk Disclaimer
Trading financial instruments carries significant risk and may not be suitable for all investors. Past performance does not guarantee future results. This content is for educational purposes only and should not be considered investment advice. Always conduct your own research before trading.