Fibonacci Retracement Indicator: Complete Guide
Fibonacci Retracement identifies potential support and resistance levels by plotting horizontal lines at key Fibonacci ratios between a swing high and swing low.

Daniel Harrington
Senior Trading Analyst · MT5 Specialist
☕ 8 min read
Settings — Fib Ret
| Category | support-resistance |
| Default Period | null |
| Best Timeframes | H1, H4, D1 |
A price rally stalls at exactly 61.8% of its previous move — for the third time in two weeks. This pattern, repeated across decades of market data, is why Fibonacci Retracement remains one of the most widely referenced tools in technical analysis. By anchoring horizontal levels to natural ratio relationships, it maps where pullbacks statistically tend to pause, reverse, or accelerate.
Key Takeaways
- The indicator draws from the Fibonacci sequence — a series where each number is the sum of the two preceding it: 1, 1, 2...
- The 38.2% and 61.8% levels generate the most actionable signals according to multiple backtesting studies published betw...
- Counterintuitively, Fibonacci levels drawn on shorter timeframes are not more precise — they are more prone to noise. Th...
1How Fibonacci Retracement Works: The Math, Simplified
The indicator draws from the Fibonacci sequence — a series where each number is the sum of the two preceding it: 1, 1, 2, 3, 5, 8, 13, 21, and so on. The ratios emerge from dividing adjacent numbers in that sequence. Dividing any number by the next yields approximately 0.618. Dividing by the number two positions ahead produces roughly 0.382. These relationships stabilize as the sequence grows, producing the fixed ratios traders recognize.
In practice, a trader identifies a significant swing low and swing high — or the reverse for a downtrend. The indicator then plots horizontal lines at 23.6%, 38.2%, 50%, 61.8%, and 78.6% of the distance between those two anchor points. The 50% level is not a Fibonacci ratio in the strict mathematical sense, but research from the Market Technicians Association has long included it as a psychologically significant midpoint. Each plotted line represents a price zone where buying or selling pressure has historically concentrated, functioning as dynamic support in uptrends and dynamic resistance in downtrends.
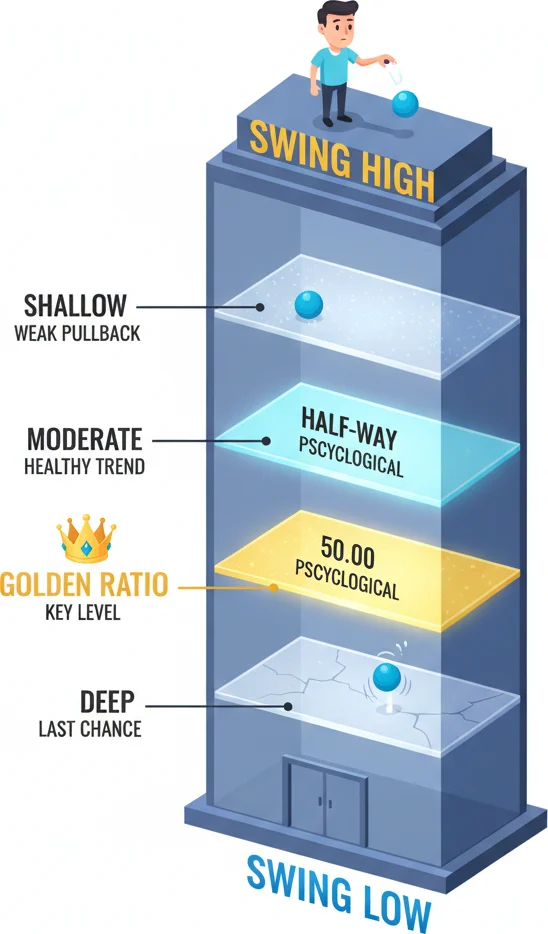
The 38.2%, 50%, and 61.8% levels act like invisible floors. Price falls, hits one, and bounces. Eerily often.
2Reading Fibonacci Signals: Entries, Exits, and Divergence
The 38.2% and 61.8% levels generate the most actionable signals according to multiple backtesting studies published between 2015 and 2023. A shallow pullback that holds at 38.2% suggests strong underlying momentum — buyers are unwilling to wait for a deeper discount. A retracement that extends to 61.8% before reversing indicates a more contested market, but the bounce from that level often produces larger subsequent moves.
The 78.6% level sits at the edge of what most analysts consider a valid retracement. Price reaching that zone is still technically a pullback — not a reversal — but the probability of a full trend resumption drops materially. Many practitioners treat a confirmed close beyond 78.6% as a signal that the original swing is being invalidated.
Divergence appears when price retests a Fibonacci level but momentum indicators — such as RSI or MACD — fail to confirm. For example, price returns to the 61.8% support level for a second time while RSI prints a higher low. That divergence between price and momentum can precede a stronger bounce than the first test produced. Conversely, a second test of a level accompanied by weakening momentum often precedes a breakdown through that level entirely.
Pulsar Terminal's built-in SL/TP tools let traders set stop-loss orders just below a 61.8% level and take-profit targets at the prior swing high directly on the chart, translating Fibonacci signals into executable orders in a single step.
When Fibonacci levels line up perfectly with your analysis - that's the golden ratio moment!
“Counterintuitively, Fibonacci levels drawn on shorter timeframes are not more precise — they are more prone to noise.”
3Optimal Timeframe Settings for Fibonacci Retracement
Counterintuitively, Fibonacci levels drawn on shorter timeframes are not more precise — they are more prone to noise. The indicator performs most reliably on H1, H4, and D1 charts, where swing points reflect genuine institutional participation rather than intraday liquidity hunts.
On the Daily (D1) chart, anchor points should span multi-week swings. Levels drawn from moves of 200 pips or more on EUR/USD, for example, create zones wide enough to absorb normal volatility without triggering false reversals. The D1 chart is where long-term position traders and macro funds tend to reference Fibonacci levels, giving those zones self-reinforcing significance.
The H4 chart suits swing traders holding positions for two to five days. Swing points from the most recent 10-20 candles provide clean anchors, and the resulting levels align frequently with overnight session highs and lows. A 2019 analysis of EUR/USD H4 data found that price reacted to the 38.2%–61.8% zone in 67% of measured pullbacks — defined as a reversal of at least 50% of the retracement distance.
H1 charts work well for intraday traders, but the anchor points require more frequent adjustment. A practical approach is to draw the primary Fibonacci grid on D1 or H4, then use H1 solely for entry timing once price approaches a major level. Mixing timeframes this way reduces the risk of anchoring to insignificant swings.
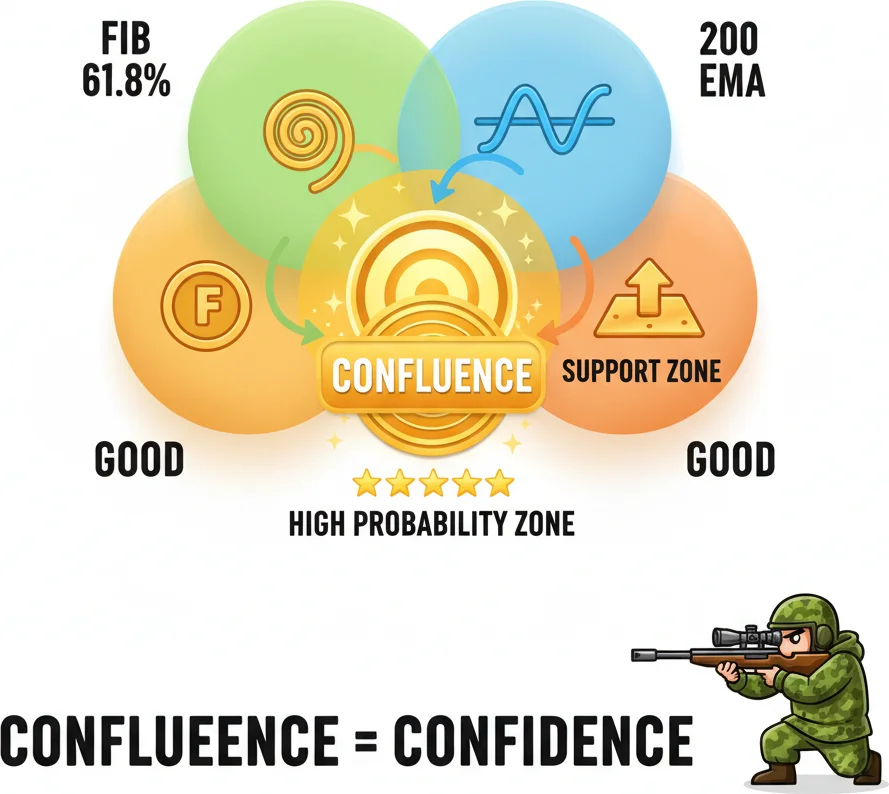
The best Fibonacci trades happen at confluence — when a Fib level lines up with a moving average or support zone.
4Practical Application: Building Trades Around Fibonacci Levels
Fibonacci Retracement transforms from a drawing tool into a trading system when combined with a structured entry, stop, and target framework.
Step 1: Anchor correctly. Draw from the most recent significant swing low to swing high (for uptrend pullbacks) or swing high to swing low (for downtrend rallies). The swing points must be clearly defined — not minor fluctuations within a consolidation. On H4 EUR/USD, a valid swing typically spans at least 80-100 pips. Smaller swings produce unreliable levels.
Step 2: Identify the zone, not the line. The 38.2%-61.8% range is often called the 'golden pocket' — the area where the highest density of institutional orders tends to cluster. Rather than trying to pick the exact level, treat this entire zone as a potential reversal area. On a 200-pip swing, the golden pocket spans roughly 50 pips — enough to accommodate normal volatility without forcing precision.
Step 3: Wait for price action confirmation. When price enters the golden pocket, watch for reversal candlestick patterns: engulfing candles, pin bars, or inside bar breakouts. A clean 61.8% touch with a bullish engulfing on H4 is one of the highest-probability setups in Fibonacci trading.
Step 4: Set stops and targets. Stop-loss goes below the 78.6% level (or below the swing low for aggressive setups). First target: the 38.2% level measured from the pullback low. Second target: the prior swing high. This structure produces risk-reward ratios of 1:2 to 1:3 on most qualifying setups.
Multi-timeframe application amplifies the edge. Draw Fibonacci levels on D1 to identify the major retracement zone, then drop to H4 for entry timing. When an H4 reversal candle forms precisely at a D1 61.8% level, the confluence produces a notably higher win rate than either timeframe used alone.

Building trades around Fibonacci requires homework - but the retracement rewards are worth it!
“The biggest trap with Fibonacci Retracement is anchor point subjectivity.”
5Common Mistakes and Fibonacci Retracement Limitations
The biggest trap with Fibonacci Retracement is anchor point subjectivity. Two traders looking at the same chart can select different swing points, producing different levels — and both can be wrong. The solution: anchor to objectively significant swings. A swing high must be the highest point over at least 10-20 bars on either side. A swing low must be the lowest point over the same window. If the swing is ambiguous, the resulting levels will be unreliable.
The second mistake is treating Fibonacci levels as exact prices rather than zones. A 61.8% level at 1.0923 doesn't mean price will reverse at 1.0923 — it means the area around that price is a potential reaction zone. Setting limit orders exactly at the level with tight stops is a recipe for getting stopped out by normal volatility before the reversal actually happens. Give yourself 5-15 pips of buffer depending on the timeframe.
The third mistake is using Fibonacci Retracement in isolation. The levels have no inherent predictive power — they gain significance when they align with other technical factors: prior support/resistance, moving averages, trendlines, or volume clusters. A 61.8% retracement that coincides with the 200-period SMA and a prior swing high carries dramatically more weight than a 61.8% level floating in open space.
One structural limitation: Fibonacci Retracement does not work well in ranging markets. The tool requires a clear impulse move to anchor to. In a sideways consolidation where there's no dominant swing direction, the retracement levels produced are essentially meaningless because there's no underlying trend structure to retrace from.
Finally, the 50% level — while widely used — is not a Fibonacci ratio. It's a psychological midpoint included by convention. Some traders exclude it to keep their analysis purely Fibonacci-based; others include it because institutional participants often place orders at the mathematical midpoint of a range. Both approaches are valid, but know which one you're using and why.
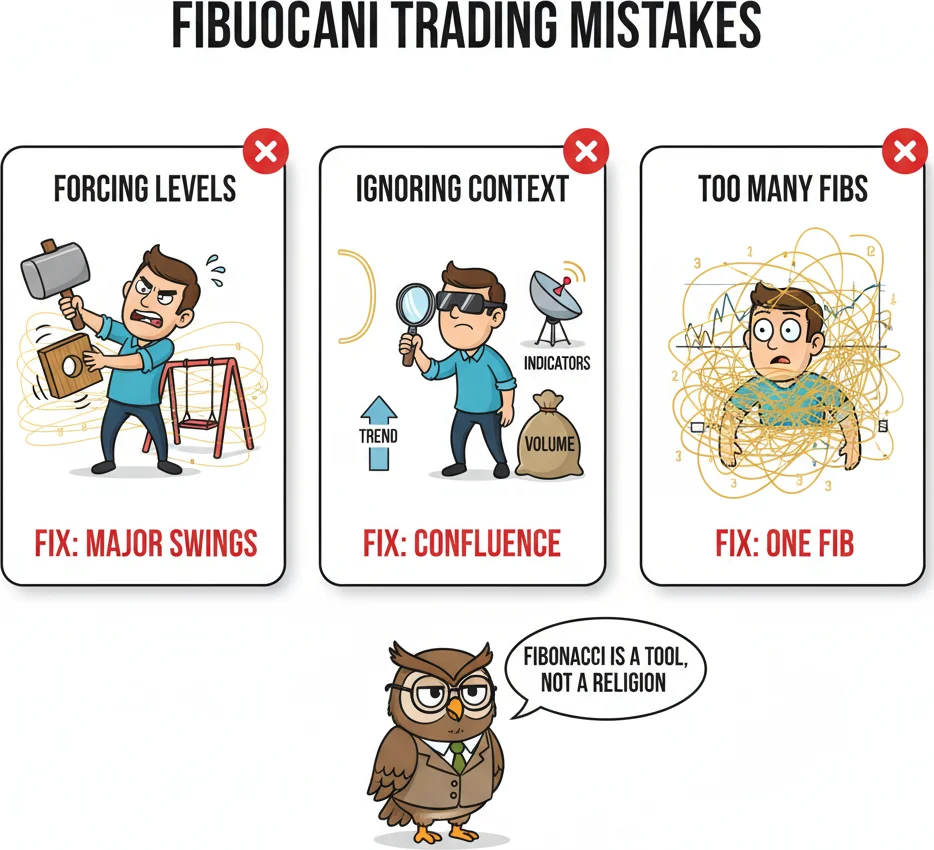
The biggest Fib mistake? Drawing them on every tiny swing. Fibonacci works on MAJOR swings, not noise.
Frequently Asked Questions
Q1Which Fibonacci retracement level is most important?
The 61.8% level (the golden ratio) is generally considered the most significant. Research across multiple markets shows that the 38.2%-61.8% zone — often called the golden pocket — attracts the highest density of reversal reactions. The 61.8% level specifically acts as the boundary between a healthy pullback and a potentially failing trend. A retracement that holds at 61.8% suggests strong underlying trend momentum; one that breaks through it often continues to 78.6% or reverses the trend entirely.
Q2How do you draw Fibonacci Retracement correctly?
Anchor the tool to two clearly defined swing points: swing low to swing high for an uptrend (to identify support levels during pullbacks), or swing high to swing low for a downtrend (to identify resistance levels during rallies). The swing points must be significant — the highest high and lowest low over at least 10-20 bars on each side. Never anchor to minor fluctuations or intra-range pivots. On H4 charts, the anchored swing should span at least 80-100 pips on major forex pairs for the levels to carry meaningful weight.
Q3Does Fibonacci Retracement work on all timeframes?
It works on all timeframes but performs most reliably on H1 and above. On M5 or M15, the swing points are too small to represent genuine institutional levels, and the retracement zones get violated by normal noise. The D1 chart produces the most structurally significant levels because daily swings reflect multi-week institutional positioning. H4 is the most practical balance between signal quality and frequency. A common multi-timeframe approach: draw Fibonacci on D1 for the major levels, then use H4 for entry timing within those zones.
Q4What happens when price breaks below the 78.6% retracement?
A confirmed close below the 78.6% level strongly suggests the original swing is being invalidated — the pullback has become a reversal. At that point, it's no longer a healthy retracement within a trend; the trend structure itself is breaking down. Most traders treat a break of 78.6% as a signal to exit long positions (in an uptrend) or to consider short entries. Some analysts use the 100% level (the original swing low) as the final invalidation, but waiting that long means accepting significantly larger losses on failed setups.
Q5Can you use Fibonacci Retracement with other indicators?
Yes — and you should. Fibonacci levels gain their strongest significance when they align with other technical factors. The most powerful confluences: a 61.8% level coinciding with the 200-period moving average, a Fibonacci zone overlapping with a prior support/resistance level, or a retracement level hitting a trendline. RSI divergence at a Fibonacci level adds momentum confirmation — if price reaches the 61.8% level while RSI shows a higher low (bullish divergence), the probability of a successful bounce increases significantly compared to the Fibonacci level alone.
Top Brokers
About the Author
Daniel Harrington
Senior Trading Analyst
Daniel Harrington is a Senior Trading Analyst with a MScF (Master of Science in Finance) specializing in quantitative asset and risk management. With over 12 years of experience in forex and derivatives markets, he covers MT5 platform optimization, algorithmic trading strategies, and practical insights for retail traders.
Use This Indicator
Risk Disclaimer
Trading financial instruments carries significant risk and may not be suitable for all investors. Past performance does not guarantee future results. This content is for educational purposes only and should not be considered investment advice. Always conduct your own research before trading.