Fisher Transform Indicator: John Ehlers' Sharp Reversal Signal Tool
Fisher Transform converts prices into a Gaussian normal distribution, creating sharp turning points that make trend reversals easier to identify.

Daniel Harrington
Senior Trading Analyst · MT5 Specialist
☕ 17 min read
Settings — Fisher
| Category | oscillator |
| Default Period | 10 |
| Best Timeframes | M15, H1, H4 |
Most oscillators smooth price into gentle waves that roll back and forth, making reversals look like slow U-turns. The Fisher Transform does the opposite — it takes price, squeezes it through a mathematical wringer, and spits out razor-sharp peaks and valleys that practically scream 'turn around.' Developed by John F. Ehlers, a digital signal processing engineer who brought hardcore math into trading indicator design, the Fisher Transform converts normalized price into a Gaussian (bell curve) distribution where extreme values are statistically rare. When those extreme values do show up, they demand attention. The result is an oscillator with an attitude: fast to spike, fast to cross, and fast to tell you the current move is running on empty. If you've been frustrated by lagging signals from smoother indicators, the Fisher Transform is Ehlers' answer — a leading oscillator that trades smoothness for speed and doesn't apologize for it.
Key Takeaways
- John Ehlers came from the world of electrical engineering and signal processing before he ever touched a price chart. Hi...
- The first thing you'll notice when you add the Fisher Transform to a chart is how different it looks from RSI or Stochas...
- The Fisher Transform's crossover system is its bread-and-butter signal — and it's noticeably faster than crossovers on m...
1Ehlers' Statistical Trick: Turning Price Into a Gaussian Distribution
John Ehlers came from the world of electrical engineering and signal processing before he ever touched a price chart. His big insight was simple but powerful: price data does not follow a normal (Gaussian) distribution. Prices cluster in the middle of a range and only occasionally push to extremes — but standard oscillators don't emphasize those extremes nearly enough. What if you could mathematically transform price so that big moves become statistically obvious?
That's exactly what the Fisher Transform does. Here's the process, step by step:
Step 1 — Calculate the midpoint price. For each bar, take (High + Low) / 2. This gives you a smoothed representation of where price actually traded, not just where it closed.
Step 2 — Normalize the midpoint to a -1 to +1 range. Using a lookback period (default is 10 on most platforms, Ehlers originally used 9), the indicator finds the highest and lowest midpoint values over that window and rescales the current midpoint to fit between -1 and +1. This normalization is critical — it means the Fisher Transform adapts to recent price ranges automatically. The formula includes a 0.33 smoothing factor and incorporates the previous bar's value to reduce jitter:
Value = 0.33 x 2 x ((Midpoint - Lowest) / (Highest - Lowest) - 0.5) + 0.67 x Previous Value
The value is also clamped to stay within -0.999 and +0.999 to prevent mathematical errors in the next step.
Step 3 — Apply the Fisher Transform. This is where the magic happens:
Fisher = 0.5 x ln((1 + Value) / (1 - Value)) + 0.5 x Previous Fisher
That natural logarithm function is the Fisher Transform itself — a well-known statistical technique for converting bounded data into an unbounded Gaussian distribution. When the normalized value is near zero (price in the middle of its range), the output is modest. But when the value pushes toward +1 or -1 (price near the top or bottom of its recent range), the logarithm explodes — producing those signature sharp peaks.
| Input Value | Fisher Output | What It Means |
|---|---|---|
| 0.0 | ~0.0 | Price is mid-range, no directional pressure |
| +0.5 | ~0.55 | Moderate bullish displacement |
| +0.9 | ~1.47 | Strong bullish extreme — watch for reversal |
| +0.99 | ~2.65 | Very rare extreme — reversal highly likely |
| -0.9 | ~-1.47 | Strong bearish extreme — watch for bounce |
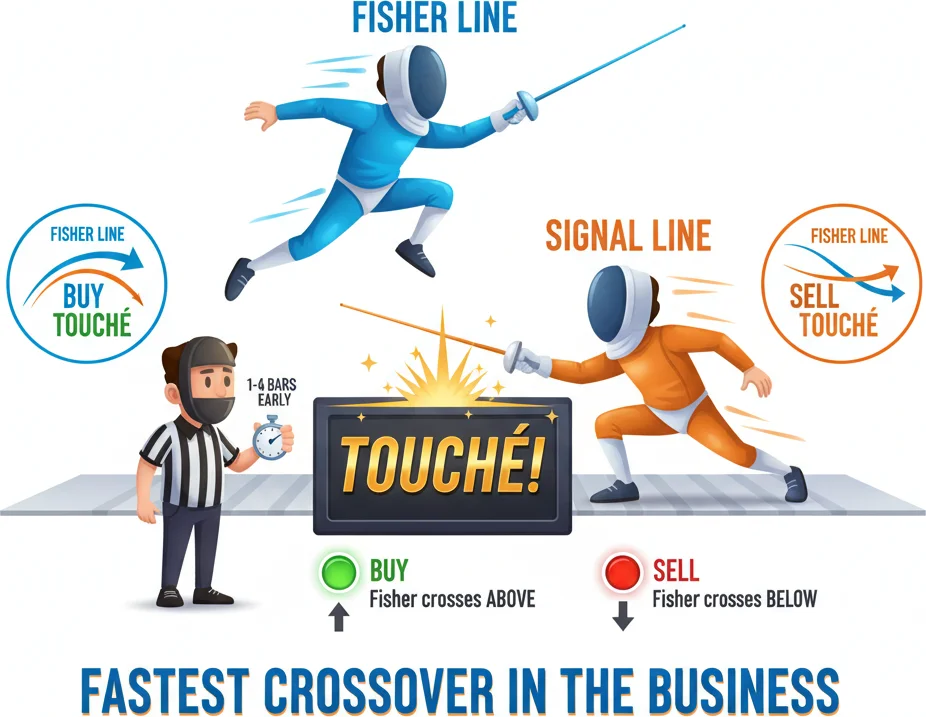
Step 4 — Plot the signal line. The signal line (sometimes called the trigger line) is simply the Fisher value from one bar ago. So you always have two lines: the Fisher line and its one-period lag. This is different from indicators that use a moving average as a signal line — the Fisher's trigger line is immediate, which is why crossovers happen fast.
The default period of 10 works well across most timeframes. Ehlers originally recommended 9, and you'll see both used interchangeably. Shorter periods (5-7) make the indicator even more reactive — useful on M15 for scalping — but increase false signals. Longer periods (13-15) smooth the output for daily charts but sacrifice the speed that makes the Fisher Transform worth using in the first place.
| Timeframe | Suggested Period | Character |
|---|---|---|
| M15 | 7-9 | Very reactive, needs filtering |
| H1 | 9-10 (default) | Good balance for intraday |
| H4 | 10-12 | Slightly smoother for swing trades |
| D1 | 10-14 | Smoothest, fewer but higher-quality signals |
The key takeaway: the Fisher Transform doesn't invent information that isn't in the price data. It amplifies what's already there by making extreme readings mathematically rare — so when they appear, you know something statistically unusual is happening. Think of it as a contrast filter for your price chart. The boring middle gets compressed. The interesting edges get stretched.
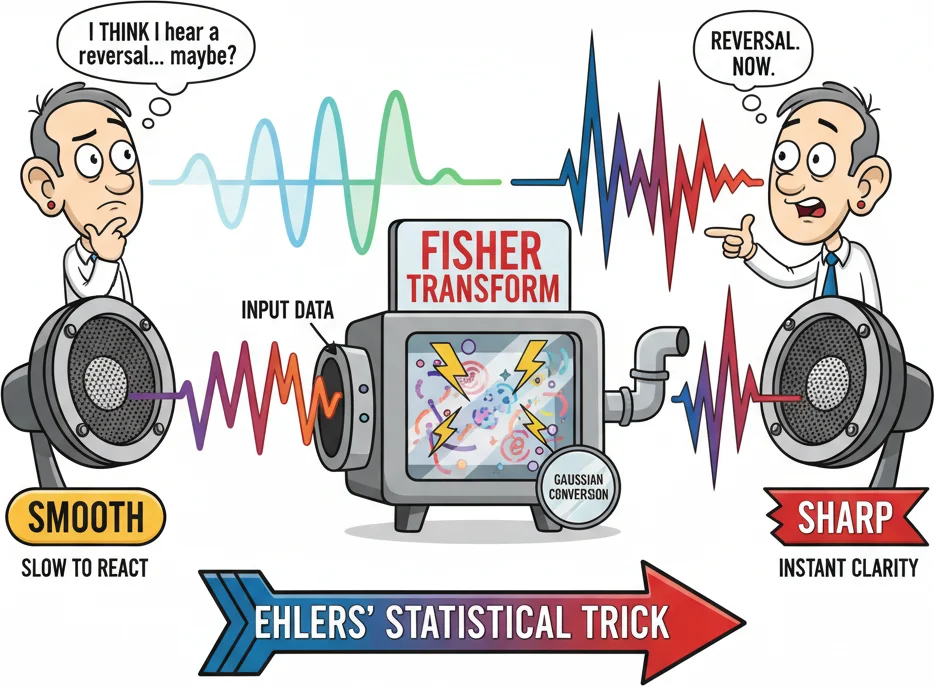
Regular oscillators give you smooth curves. Fisher Transform gives you SPIKES — razor-sharp reversal signals.
2Reading Fisher Transform: Sharp Peaks Mean Sharp Reversals
The first thing you'll notice when you add the Fisher Transform to a chart is how different it looks from RSI or Stochastic. Those indicators produce smooth, rolling waves. The Fisher Transform produces spikes — sharp peaks and sharp troughs that look almost like a heartbeat monitor. This isn't a bug. It's the entire point.
Because the Fisher Transform converts price into a Gaussian distribution, readings near the extremes are statistically rare events. When the Fisher line spikes above +1.5 or below -1.5, you're looking at a price displacement that sits in the tail end of the distribution — an event that, by the math, should not happen frequently. When it does happen, probability says a reversion toward the mean is likely. Not guaranteed — probability never guarantees anything — but the odds tilt in favor of a pullback or reversal.
Interpreting the levels:
| Fisher Reading | Interpretation | Suggested Action |
|---|---|---|
| Above +2.0 | Extreme overbought — rare event | Prepare for bearish reversal |
| +1.0 to +2.0 | Moderately bullish — extended but not extreme | Monitor, don't chase longs |
| -1.0 to +1.0 | Neutral zone — no strong directional signal | Wait for setup |
| -2.0 to -1.0 | Moderately bearish — extended but not extreme | Monitor, don't chase shorts |
| Below -2.0 | Extreme oversold — rare event | Prepare for bullish reversal |
Unlike RSI, the Fisher Transform is unbounded — it can theoretically reach any value. During powerful trending moves, you might see readings of +3.0 or even +4.0. This is important because it means you cannot blindly fade every extreme. A Fisher reading of +2.5 in a raging uptrend might just climb to +3.0 before the actual reversal happens. The extreme reading tells you the move is stretched; it doesn't tell you precisely when the elastic snaps back.
The sharpness of the peaks is what makes timing easier, though. When the Fisher line has been spiking higher and suddenly turns down — even while still in positive territory — that sharp turn itself is the signal. You don't need it to cross zero or reach the opposite extreme. The shape of the peak matters more than the absolute level.
Here's a practical example. Picture GBP/USD on the H1 chart during a European session rally. Price pushes from 1.2650 to 1.2720 over six candles. The Fisher Transform climbs from +0.3 to +2.1 during that move. Then on the seventh candle, price makes a marginal new high at 1.2725, but the Fisher line drops to +1.8. That downturn — a sharp peak followed by a visible decline — is your early warning. The upside momentum that was feeding the rally has started to exhaust. Two candles later, price pulls back to 1.2690.
The opposite pattern works identically. A sharp trough below -1.5 that hooks back up signals selling exhaustion. On USD/CHF H4, if the Fisher drops to -2.3 during a selloff and then turns up to -1.9, that reversal in the indicator often precedes a meaningful bounce — even if the bounce is just a correction within a larger downtrend.
Reading divergence on the Fisher Transform:
Divergence works particularly well with this indicator because the sharp peaks make visual comparison easy. If price makes a higher high but the Fisher peak is lower than the previous peak, that's bearish divergence — and on the Fisher Transform, it's visually obvious because the peaks are so pointed. You're comparing sharp tips, not rounded hills.
Bullish divergence (price lower low, Fisher higher low) tends to appear at the end of extended H4 and D1 selloffs. The Fisher's lower trough being less extreme than the previous one tells you the selling pressure that drove the first drop is no longer present at the same intensity. Combined with support levels or demand zones, this is one of the Fisher Transform's highest-probability setups.
One word of caution: because the indicator is unbounded and leading, it can stay at extreme levels longer than you expect in trending markets. Always use the direction of the Fisher line (turning or still pushing) rather than the absolute level as your primary read. A Fisher at +2.5 and still rising is very different from a Fisher at +2.5 and curling down.

When Fisher Transform hits extremes, it's basically screaming 'REVERSAL INCOMING!' at you.
“The Fisher Transform's crossover system is its bread-and-butter signal — and it's noticeably faster than crossovers on most other oscillators.”
3Fisher Transform Crossover Signals: Fast and Decisive
The Fisher Transform's crossover system is its bread-and-butter signal — and it's noticeably faster than crossovers on most other oscillators. Remember, the signal line is just the Fisher value from one bar ago. There's no moving average smoothing involved. This means crossovers happen the moment the Fisher line changes direction, not several bars later after a smoothed average catches up.
Bullish crossover: The Fisher line crosses above the signal line. This typically occurs when the Fisher has been declining (negative or falling) and reverses upward. The crossover itself marks the bar where upward momentum begins to dominate.
Bearish crossover: The Fisher line crosses below the signal line. This occurs when the Fisher has been rising and turns down. The crossover marks the shift to downward momentum.
On a clean chart, crossovers appear as the two lines (Fisher and its one-bar lag) switching positions. Because both lines move quickly, crossovers tend to be decisive — they snap rather than drift, which makes them easier to act on than the gradual crossovers you see on MACD.
High-probability crossover rules:
Not all crossovers are created equal. A crossover near the zero line during a range-bound market is noise. A crossover at an extreme level after a sharp spike is a signal. Here's how to rank them:
| Crossover Location | Reliability | Example |
|---|---|---|
| Bearish crossover above +1.5 | High | Fisher peaked at +2.1, crosses down |
| Bullish crossover below -1.5 | High | Fisher troughed at -1.8, crosses up |
| Any crossover between -0.5 and +0.5 | Low | Fisher wobbling near zero line |
| Crossover in direction of higher TF trend | High | H4 trend is bullish, H1 bullish crossover |
| Crossover against higher TF trend | Moderate | Counter-trend, needs extra confirmation |
The strongest signals come from extreme crossovers — crossovers that occur after the Fisher has reached an extreme reading and turns back. If the Fisher spiked to +2.3 and then crosses below the signal line, that bearish crossover carries real weight because it's happening at a statistically rare level. Compare that to a crossover at +0.4 — not much information there.
Practical crossover strategy on H1:
- Wait for the Fisher Transform (period 10) to reach above +1.5 or below -1.5.
- Wait for a crossover in the opposite direction (Fisher crosses below signal line if above +1.5, or above signal line if below -1.5).
- Enter on the close of the crossover candle.
- Place stop-loss beyond the recent swing high (for shorts) or swing low (for longs).
- Target the next support/resistance level or use a 1:1.5 to 1:2 risk-reward ratio.
This simple approach filters out the majority of low-quality crossovers near the zero line. On EUR/USD H1, you might get 3-5 high-quality extreme crossovers per week during volatile periods — enough to build a trading plan around without being overwhelmed by signals.
Zero-line crossovers:
The Fisher Transform also produces zero-line crossovers — when the Fisher line itself crosses above or below zero. This is a simpler signal that indicates the overall short-term bias has shifted from bearish to bullish (crossing above zero) or vice versa. Think of it as a trend filter rather than an entry trigger:
- Fisher above zero = short-term bullish bias, favor long setups
- Fisher below zero = short-term bearish bias, favor short setups
Some traders combine both: use the zero-line position to determine direction, then use the extreme crossover for timing. For instance, if the Fisher is above zero (bullish bias) and then dips to -1.6 on a pullback before producing a bullish crossover, that's a counter-swing entry within an overall bullish environment. Not bad.
Speed advantage and its tradeoff:
The Fisher Transform's crossover speed is both its strength and its risk. Because there's no smoothing on the signal line, you get entries that are typically 1-3 bars earlier than an equivalent MACD crossover. In fast-moving markets like GBP/JPY on H1, those 1-3 bars can mean 30-50 pips of improved entry price. But that same speed also means more crossovers overall — including minor ones during consolidation that go nowhere. The extreme-level filter above is your best defense against whipsaws, but even with it, expect some false signals. No oscillator eliminates them entirely — not even one designed by an engineer.
When Fisher crosses its signal line at an extreme, do not hesitate. These signals are designed to be fast and decisive.
4Fisher Transform for Counter-Trend Trading on H1
Counter-trend trading gets a bad reputation because most traders try it with the wrong tools. Lagging indicators tell you a trend is overextended only after it's already reversed — by which point the counter-trend move is half over. The Fisher Transform is one of the few oscillators genuinely suited for catching turns early, which is exactly what counter-trend trading demands.
The H1 timeframe is a sweet spot for this approach. It's fast enough to capture intraday swings (most H1 counter-trend trades last 4-12 candles, so roughly half a session to a full session) but slow enough that the Fisher Transform's signals aren't drowned in M5-level noise. On H1, a Fisher extreme reading represents a meaningful displacement — not just a random tick.
The H1 Counter-Trend Setup:
Step 1 — Identify the higher-timeframe context on H4. This is non-negotiable. You're trading counter-trend on H1, so you need to know where the H4 chart says price is likely to bounce. Look for obvious support and resistance levels, Fibonacci retracements, or supply/demand zones on H4. Counter-trend trades that align with H4 structure have dramatically better odds than those taken in a vacuum.
Step 2 — Wait for a Fisher extreme on H1. You want the Fisher Transform (period 10) to reach above +1.5 for a potential short or below -1.5 for a potential long. Readings beyond +/-2.0 are even stronger. The more extreme the reading, the more stretched the move is statistically.
Step 3 — Wait for the Fisher to turn. Don't enter just because the Fisher is extreme. Wait for the actual turn: the Fisher line must begin declining (for shorts) or rising (for longs). Ideally, you see a crossover with the signal line at the extreme. This is your confirmation that the momentum pushing the extreme has broken.
Step 4 — Enter with a candlestick trigger. On the H1 candle where the Fisher turns, look for a reversal candlestick pattern: a pin bar, engulfing candle, or doji. This adds a price action layer to the indicator signal. If the candle just has a small body with no reversal character, consider waiting one more candle.
Step 5 — Set stop-loss and target. Place the stop beyond the extreme of the move (the swing high for shorts, swing low for longs). Target the nearest H4 support/resistance level or use a fixed risk-reward of 1:1.5 minimum.
| Element | Criteria |
|---|---|
| Timeframe | H1 (entry), H4 (context) |
| Fisher period | 10 |
| Entry trigger | Fisher extreme (+/-1.5) + turn + candle pattern |
| Stop-loss | Beyond the swing extreme |
| Target | Next H4 S/R level or 1:1.5 R:R |
| Session filter | London or NY session (avoid Asian for most pairs) |
Example walkthrough: EUR/USD is in a moderate uptrend on H4, trading between 1.0850 and 1.0950. On H1, a sharp rally pushes price from 1.0880 to 1.0945 over eight candles. The Fisher Transform reaches +2.4 — a significant extreme. Price hits the H4 resistance zone near 1.0950. The ninth H1 candle forms a bearish engulfing pattern, and the Fisher line crosses below the signal line from +2.4 to +2.0. This is the setup: extreme Fisher reading, structural resistance, bearish candle, Fisher crossover. You enter short at 1.0940 with a stop at 1.0960 (20 pips) and target 1.0890 (50 pips). The risk-reward is 1:2.5.
What to avoid:
-
Counter-trend trades against a strong H4 trend with no structural level nearby. If H4 is in a clean uptrend with no resistance in sight, fading H1 Fisher extremes is a recipe for getting steamrolled. The Fisher can stay extreme for much longer than your stop-loss can handle.
-
Trading during low-volatility sessions. The Asian session (except for JPY and AUD pairs) produces narrow ranges where Fisher readings rarely reach meaningful extremes. Wait for London or New York.
-
Ignoring the turn. An extreme reading alone is not an entry. The Fisher at +2.5 and still rising means the extreme is getting more extreme — not that it's done. Wait for the turn. Patience is the difference between a counter-trend trade and a kamikaze entry.
Adding RSI as a confirmation filter:
A useful addition to this setup is checking RSI (14) at the same time the Fisher reaches its extreme. If Fisher is above +2.0 and RSI is above 70, you have dual confirmation that the move is overextended. This doesn't happen on every setup, but when it does, the probability of a reversal increases noticeably. Two independent indicators agreeing on an extreme is more convincing than one.

Counter-trend trading: sometimes the 'obvious' reversal signal gets rejected harder than a bad pickup line.
“The Fisher Transform and RSI are both oscillators, both used to detect overbought/oversold conditions, and both popular with retail forex traders.”
5Fisher Transform vs RSI: Different Math, Different Timing
The Fisher Transform and RSI are both oscillators, both used to detect overbought/oversold conditions, and both popular with retail forex traders. But the similarities end there. Under the hood, they're built on completely different mathematical foundations — and those differences produce meaningfully different behavior on your chart.
What RSI measures: RSI (Relative Strength Index) calculates the ratio of average gains to average losses over a lookback period (typically 14). The output is bounded between 0 and 100, with 70 traditionally marking overbought and 30 marking oversold. RSI uses exponential smoothing, which means each new bar's contribution to the average fades gradually. This creates a smooth, rolling indicator that reacts steadily to price changes.
What Fisher Transform measures: The Fisher Transform normalizes price to a -1/+1 range and then applies a logarithmic transformation to produce a Gaussian distribution. The output is unbounded — it can reach any value. There are no fixed overbought/oversold lines (though traders commonly use +/-1.5 or +/-2.0 as reference levels). The lack of heavy smoothing means the indicator reacts sharply to price changes.
| Feature | Fisher Transform | RSI |
|---|---|---|
| Creator | John Ehlers | J. Welles Wilder |
| Input | Midpoint price (HL/2) | Closing price gains/losses |
| Math | Gaussian normalization + log transform | Exponential smoothing of gain/loss ratio |
| Output range | Unbounded (-4 to +4 typical) | Bounded (0 to 100) |
| Default period | 10 | 14 |
| OB/OS levels | No fixed levels (~+/-1.5 common) | Fixed: 70/30 |
| Signal line | 1-bar lag (no smoothing) | None standard (some add MA) |
| Signal speed | Fast — leading | Moderate — coincident to slightly lagging |
| Shape | Sharp spikes and peaks | Smooth rolling waves |
| False signals | More frequent in ranges | Fewer in ranges, more in trends |
Timing difference in practice:
This is the most important practical distinction. The Fisher Transform typically signals reversals 1-4 bars before RSI does. On EUR/USD H1, when a selloff exhausts and price begins to reverse, the Fisher Transform will often produce a bullish crossover while RSI is still falling toward or sitting at 30. By the time RSI crosses back above 30 (a common entry trigger for RSI traders), the Fisher Transform has already signaled — and the first 15-30 pips of the reversal are already on the table.
The flip side: those 1-4 bars of speed come with a cost. The Fisher Transform will also produce crossovers on moves that don't follow through — minor bounces within a larger selloff that RSI correctly ignores because it's still deeply oversold. RSI's smoothing acts as a built-in noise filter. Fisher's lack of smoothing acts as a built-in impatience generator.
Where Fisher wins:
-
Sharp reversal detection. If you need to catch the turn as early as possible — for counter-trend scalps or aggressive reversal entries — the Fisher Transform gives you first-mover advantage. On volatile pairs like GBP/JPY, that speed advantage translates directly into better entry prices.
-
Visual clarity of extremes. Fisher's sharp peaks make it trivially easy to spot divergence and extreme readings. RSI's smooth curves sometimes make it hard to tell exactly where the peak occurred. With Fisher, the spike tip is unmistakable.
-
Crossover precision. The Fisher's crossover with its signal line is immediate and decisive. RSI doesn't have a standard signal line (though some traders add a moving average to it), so crossover-based strategies require extra configuration.
Where RSI wins:
-
Trend identification. RSI staying above 50 for extended periods clearly identifies an uptrend. RSI staying below 50 identifies a downtrend. The Fisher Transform oscillates around zero too quickly to serve as a reliable trend identifier — it's designed for reversals, not trend measurement.
-
Fixed reference levels. RSI's 70/30 levels are universal. You can apply the same overbought/oversold thresholds to any market without adjustment. Fisher Transform requires you to calibrate extreme levels to each instrument and timeframe based on historical readings. On some instruments, +1.5 is extreme; on others, +2.5 is routine.
-
Lower false signal rate in ranges. RSI's smoothing means it doesn't whipsaw as aggressively during consolidation phases. Fisher Transform, with its sharp peaks, will produce multiple crossovers during a range that RSI calmly ignores.
Using them together:
Rather than choosing one over the other, many traders use both in a complementary way:
-
Fisher for timing, RSI for context. Use RSI to confirm whether the market is in overbought/oversold territory (above 70 or below 30). Then use the Fisher Transform crossover within that RSI extreme zone as your precise entry trigger. RSI says 'the zone is right.' Fisher says 'now.'
-
Fisher for entry, RSI for exit. Enter on a Fisher extreme crossover. Hold the trade until RSI reaches the opposite extreme (e.g., enter long on a Fisher bullish crossover when RSI is below 30, exit when RSI approaches 70). Fisher gets you in early; RSI's slower pace lets you ride the move without being shaken out by Fisher's next crossover.
-
Dual divergence confirmation. If both Fisher Transform and RSI show divergence with price at the same swing point, the reversal probability is significantly higher than either signal alone. This dual divergence setup is relatively rare — maybe once or twice a month on H1 — but when it occurs, it's one of the highest-confidence reversal signals available without adding a third indicator.
Bottom line: RSI is the safe, steady all-rounder that works everywhere. Fisher Transform is the specialist — faster, sharper, and more opinionated, but requiring more skill to filter the noise. For traders who want maximum speed on reversal detection and are willing to add filters (multi-timeframe analysis, support/resistance, or RSI itself), the Fisher Transform is worth mastering.
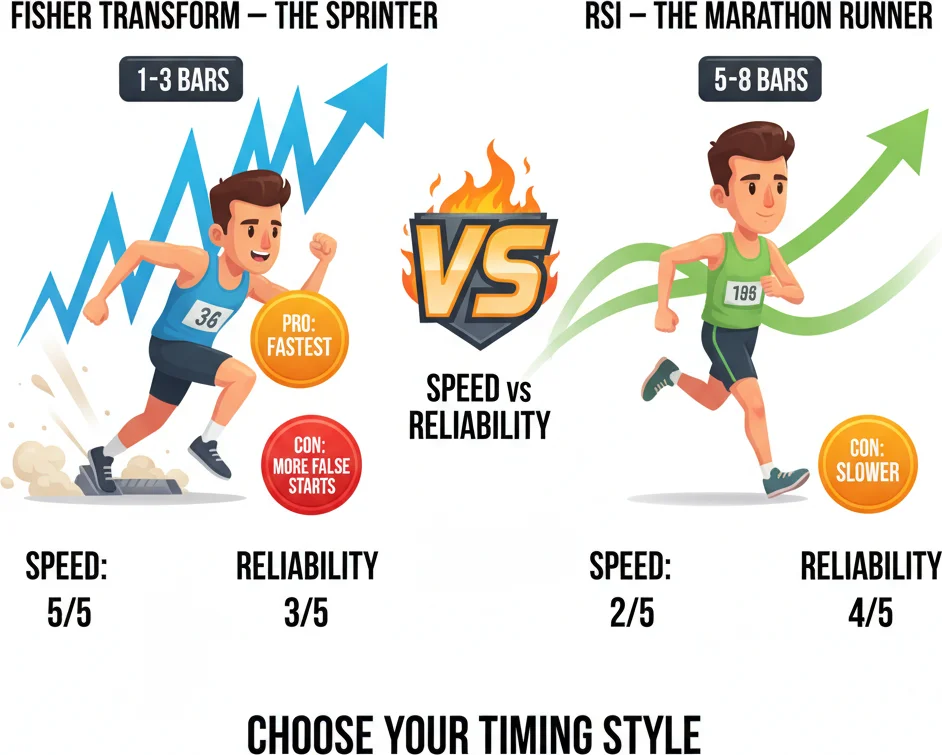
RSI takes 5-8 bars to signal a reversal. Fisher Transform can do it in 1-3 bars. Speed has a price though.
Frequently Asked Questions
Q1What is the best period setting for the Fisher Transform indicator?
The default period of 10 (some platforms use 9, as Ehlers originally proposed) works well for most situations on H1 and H4 charts. For M15 scalping, reduce to 7-8 for faster signals, accepting more noise. For D1 charts, 10-14 smooths the output while retaining the indicator's speed advantage. Avoid going below 5 — the indicator becomes erratic — or above 20, where you lose the sharp peak behavior that makes the Fisher Transform useful in the first place.
Q2Is the Fisher Transform a leading or lagging indicator?
The Fisher Transform is classified as a leading indicator. It typically signals reversals 1-4 bars before most smoothed oscillators like RSI or Stochastic. This leading nature comes from its minimal smoothing and the logarithmic transformation that amplifies extreme readings. However, leading also means more false signals — the indicator will occasionally call a reversal that doesn't materialize. Always use confirmation tools like support/resistance levels, candlestick patterns, or a second indicator before acting on Fisher signals alone.
Q3What do extreme Fisher Transform values like +3 or -3 mean?
Values beyond +/-2.0 indicate that price has moved to a statistically rare extreme relative to its recent range. The higher the absolute value, the more stretched the move. A reading of +3.0 means price is extremely overbought on the Fisher scale, and probability favors a pullback. However, the Fisher Transform is unbounded — in strong trending markets, readings can reach +4.0 or higher before reversing. Never short simply because the Fisher is 'high.' Wait for the indicator to actually turn down (a peak followed by a declining reading or a crossover) before trading against the extreme.
Q4Can the Fisher Transform be used on stocks and crypto, or only forex?
The Fisher Transform works on any price series with open, high, low, and close data — forex, stocks, indices, commodities, and crypto. The mathematical transformation is agnostic to the asset class. However, you may need to adjust your interpretation of extreme levels for each market. Crypto assets like Bitcoin produce larger Fisher extremes due to higher volatility, so thresholds of +/-2.5 or even +/-3.0 might be more appropriate than the +/-1.5 used on calmer forex pairs.
Q5How do I avoid false signals from the Fisher Transform?
Three practical filters reduce false signals significantly. First, only trade crossovers that occur at extreme levels (above +1.5 or below -1.5) — ignore crossovers near zero. Second, use multi-timeframe analysis: check the H4 trend direction before taking H1 signals, and only trade Fisher signals that align with or occur at structural levels on the higher timeframe. Third, add a confirmation indicator like RSI — when both Fisher and RSI agree on an overbought or oversold condition, the signal quality improves substantially. No filter eliminates false signals entirely, but these three combined remove the majority of low-quality setups.
Top Brokers
About the Author
Daniel Harrington
Senior Trading Analyst
Daniel Harrington is a Senior Trading Analyst with a MScF (Master of Science in Finance) specializing in quantitative asset and risk management. With over 12 years of experience in forex and derivatives markets, he covers MT5 platform optimization, algorithmic trading strategies, and practical insights for retail traders.
Use This Indicator
Risk Disclaimer
Trading financial instruments carries significant risk and may not be suitable for all investors. Past performance does not guarantee future results. This content is for educational purposes only and should not be considered investment advice. Always conduct your own research before trading.