Heikin Ashi Indicator: Complete Trading Guide
Heikin Ashi modifies candlestick calculations by averaging price data, producing smoother candles that filter noise and make trends easier to spot and follow.

Daniel Harrington
Senior Trading Analyst · MT5 Specialist
☕ 8 min read
Settings — HA
| Category | custom |
| Default Period | null |
| Best Timeframes | M15, H1, H4 |
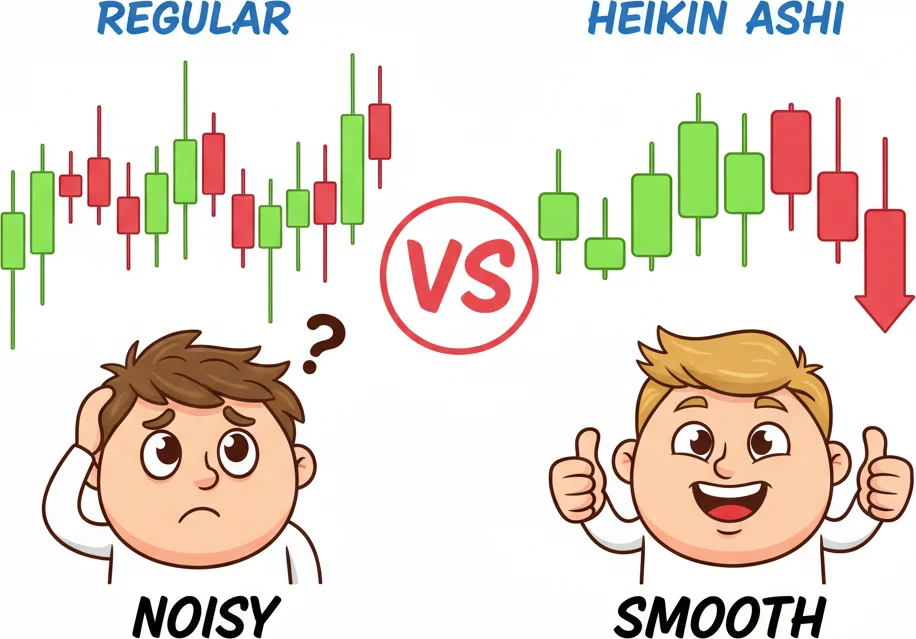
Most candlestick charts lie to you — not maliciously, but through raw noise that makes every minor fluctuation look like a potential reversal. Heikin Ashi (Japanese for 'average bar') solves this by recalculating each candle using averaged price data, producing a smoothed visual that keeps you focused on the dominant trend. The result is fewer false signals and a dramatically clearer picture of market momentum.
Key Takeaways
- Standard candlesticks plot raw open, high, low, and close prices exactly as they occur. Heikin Ashi replaces each of tho...
- Heikin Ashi candles communicate through color, body size, and wick structure — but the rules differ meaningfully from st...
- Counterintuitively, Heikin Ashi performs worse on very short timeframes — not better. Below M15, the averaging mechanism...
1How Heikin Ashi Works: The Math Behind the Smoothing
Standard candlesticks plot raw open, high, low, and close prices exactly as they occur. Heikin Ashi replaces each of those four values with averaged equivalents, creating what looks like a candlestick chart but behaves more like a trend filter.
The four formulas are straightforward:
• HA Close = (Open + High + Low + Close) / 4 — a simple average of all four price points for the current bar. • HA Open = (Previous HA Open + Previous HA Close) / 2 — an average of the prior bar's HA open and close. • HA High = the maximum of the current High, HA Open, or HA Close. • HA Low = the minimum of the current Low, HA Open, or HA Close.
The critical detail is that HA Open depends on the previous HA bar, not the previous raw bar. This creates a chain of dependency — each candle inherits information from the one before it, which is exactly what produces the smoothing effect. Unlike a simple moving average that trails behind price, Heikin Ashi restructures the candle itself.
Why does this matter? Because the human eye is terrible at spotting trends inside noisy raw data. A sequence of 10 Heikin Ashi candles in the same color tells a story that 10 standard candles — filled with wicks and indecision patterns — completely obscure.
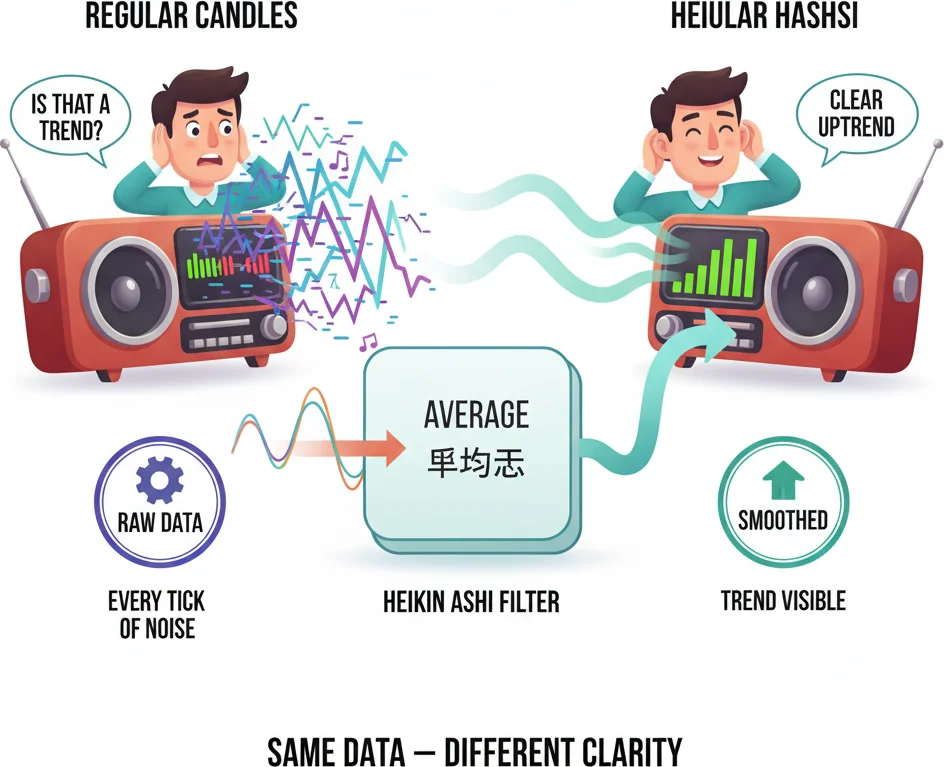
Regular candles show every tick of chaos. Heikin Ashi averages them out so you can see the actual trend.
2Reading Heikin Ashi Signals: Trends, Reversals, and Caution Zones
Heikin Ashi candles communicate through color, body size, and wick structure — but the rules differ meaningfully from standard candlestick interpretation.
Bullish signals:
- A sequence of green (or white) candles with no lower wicks indicates a strong uptrend. The absence of a lower wick means the HA Low equals either the HA Open or HA Close — price never dipped below the bar's range, suggesting consistent buying pressure.
- Large green bodies with small or absent upper wicks confirm momentum without exhaustion.
Bearish signals:
- A sequence of red candles with no upper wicks mirrors the bullish case — sustained selling with no recovery attempts within each bar.
- Shrinking red bodies signal weakening momentum before a potential reversal.
Transition signals (the most actionable):
- Small-bodied candles with wicks on both sides — similar to doji patterns — appear during trend pauses or reversals. These 'indecision bars' are Heikin Ashi's version of a warning flag. A single indecision bar after a long trend run warrants attention; two consecutive ones suggest a genuine transition.
One critical limitation compared to standard candlesticks: Heikin Ashi candles do not reflect actual open or close prices. A trader analyzing raw price levels for support/resistance must reference the original chart, not the HA values. Using HA for direction and a standard chart for precise entry levels is a common and effective combination.
For example, during the EUR/USD trend run in Q4 2023, Heikin Ashi on the H1 chart printed 14 consecutive red candles with no upper wicks — a clear signal that held through a 280-pip decline before the first indecision bar appeared near a key support zone.

Heikin Ashi candles: smoother than your morning coffee and twice as revealing.
“Counterintuitively, Heikin Ashi performs worse on very short timeframes — not better.”
3Optimal Timeframe Settings: Why M15, H1, and H4 Work Best
Counterintuitively, Heikin Ashi performs worse on very short timeframes — not better. Below M15, the averaging mechanism doesn't have enough price structure to filter meaningfully, and the smoothing creates lag that exceeds the value of the noise reduction.
Heikin Ashi has no adjustable parameters. Unlike RSI (which lets you tune the period) or moving averages (adjustable length), HA applies the same fixed formulas regardless of the asset or timeframe. This simplicity is a feature, not a limitation — there's nothing to over-optimize.
M15 (15-minute): Suited for intraday traders watching momentum shifts. On M15, HA filters out the micro-noise of individual tick clusters while remaining responsive enough to flag trend changes within 1-3 hours. Best used during high-liquidity sessions (London open, New York open) rather than overnight ranges.
H1 (1-hour): The most balanced timeframe for Heikin Ashi. The smoothing effect is pronounced enough to eliminate most false reversals, while candles still form frequently enough to give timely signals. Compared to M15, H1 HA signals produce fewer entries but a higher proportion of them align with the larger daily trend.
H4 (4-hour): Ideal for swing traders holding positions for 2-5 days. H4 HA candles represent substantial price movement — a single indecision bar here can precede a 100+ pip reversal. Unlike H1, H4 signals require patience; entries based on H4 HA often need to be managed over multiple sessions.
Pulsar Terminal's chart-integrated SL/TP tools work naturally alongside Heikin Ashi signals — for instance, placing stop-loss levels just beyond the low of the last HA indecision bar directly on the chart before executing with one click.
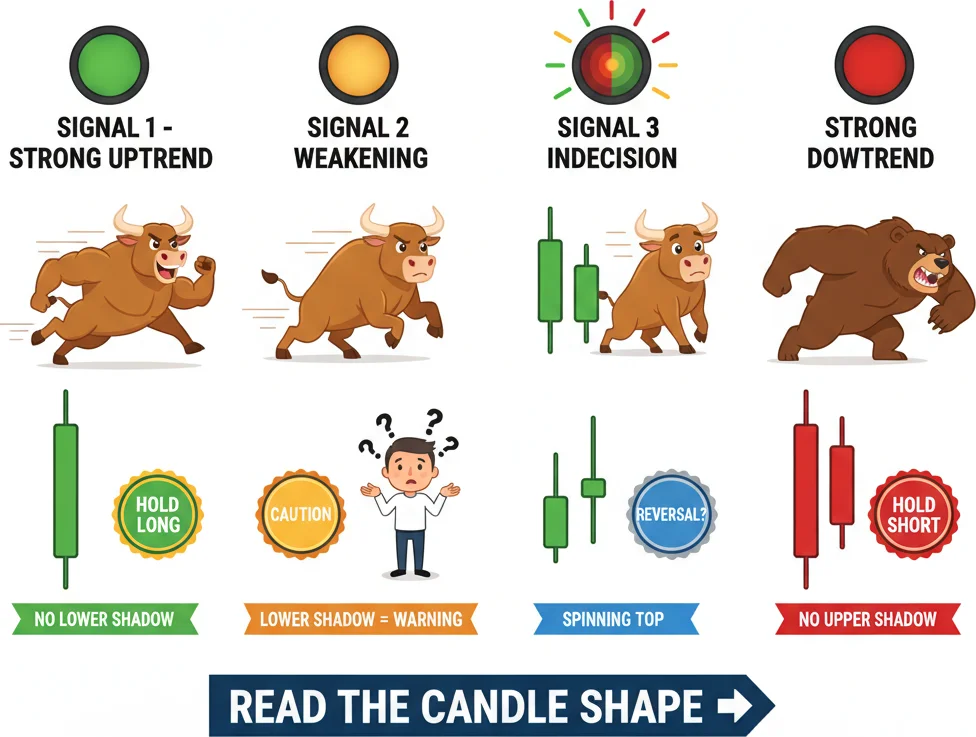
Full green body, no lower wick — that is a strong Heikin Ashi uptrend candle. The moment a wick appears below, watch out.
4Practical Application: Building a Heikin Ashi Trading Strategy
Heikin Ashi works best as a trend filter and entry timing tool — not as a precision price-level indicator. Here's how to structure a strategy around it.
Step 1: Determine trend direction on H4 or D1. A sequence of 3+ same-colored HA candles with no opposing wicks confirms the dominant trend. Green candles with no lower wicks = strong uptrend. Red candles with no upper wicks = strong downtrend. Mixed colors or doji-like bodies = no clear trend — don't trade.
Step 2: Time entries on H1 or M15. Once the higher timeframe confirms direction, drop to H1 or M15 and wait for a pullback — a brief sequence of opposing-color HA candles or small-bodied indecision bars within the larger trend. Enter when the first candle in the trend direction appears after the pullback.
Step 3: Use standard charts for stop placement. This is critical — Heikin Ashi candles don't show actual open/close prices. Switch to a standard candlestick chart to place your stop at a real support/resistance level. A common approach: use HA for direction, standard chart for the exact entry price and stop level.
Step 4: Trail stops using HA signals. Stay in the trade as long as HA candles maintain trend characteristics. When the first indecision bar appears (small body, wicks both sides), tighten your stop. Exit fully when two consecutive opposing-color candles appear or when a strong opposing-wick candle forms.
Combining with volume: HA doesn't incorporate volume information. Adding a volume overlay or momentum oscillator (RSI, MACD) helps distinguish genuine trend continuation from low-conviction grinding. Strong HA trends with expanding volume are the highest-conviction setups; HA trends with declining volume are at risk of reversal.

Remember: Heikin Ashi smooths out the noise, so take your time with entries.
“Heikin Ashi's smoothing is both its greatest strength and its most dangerous blind spot.”
5Heikin Ashi Limitations: What the Smoothing Hides
Heikin Ashi's smoothing is both its greatest strength and its most dangerous blind spot. Understanding what the averaging conceals prevents three common mistakes.
Limitation 1: HA candles don't show real prices. The HA Open and Close are calculated values, not actual market prices. An HA candle showing a 'close' at 1.0920 might correspond to a real close of 1.0935. This means you cannot use HA values for order placement — stop-loss, take-profit, and entries must reference the standard chart. Traders who set stops based on HA candle lows consistently get stopped out because the displayed low doesn't match the actual market low.
Limitation 2: Late trend-change signals. Because each HA candle inherits information from the previous one, the smoothing chain creates inherent lag. A sharp V-shaped reversal on a standard chart might take 2-3 additional bars to show up as a color change on HA. By the time HA confirms the reversal, price may have already moved 30-50 pips in the new direction. This lag is acceptable for swing traders but problematic for scalpers who need immediate reversal detection.
Limitation 3: Gap information is lost. Standard candles show gaps between close and open — valuable information about overnight sentiment shifts. HA candles eliminate gaps because the HA Open is always calculated from the prior HA bar, never from the actual market open. A 40-pip weekend gap on EUR/USD that screams 'event risk' on a standard chart is invisible on an HA chart.
Limitation 4: Not compatible with candlestick pattern analysis. Traditional patterns like hammer, engulfing, morning star require actual OHLC values. An HA 'hammer' doesn't carry the same statistical significance because the body and wicks are averaged, not raw. Don't apply Japanese candlestick pattern rules to HA candles — they are structurally different despite looking similar.
The correct framework: use Heikin Ashi for what it does well (trend identification and noise filtration) and standard charts for what HA cannot do (precise price levels, gap analysis, candlestick patterns). Running both chart types side by side — HA for direction, standard for execution — is the most practical approach.
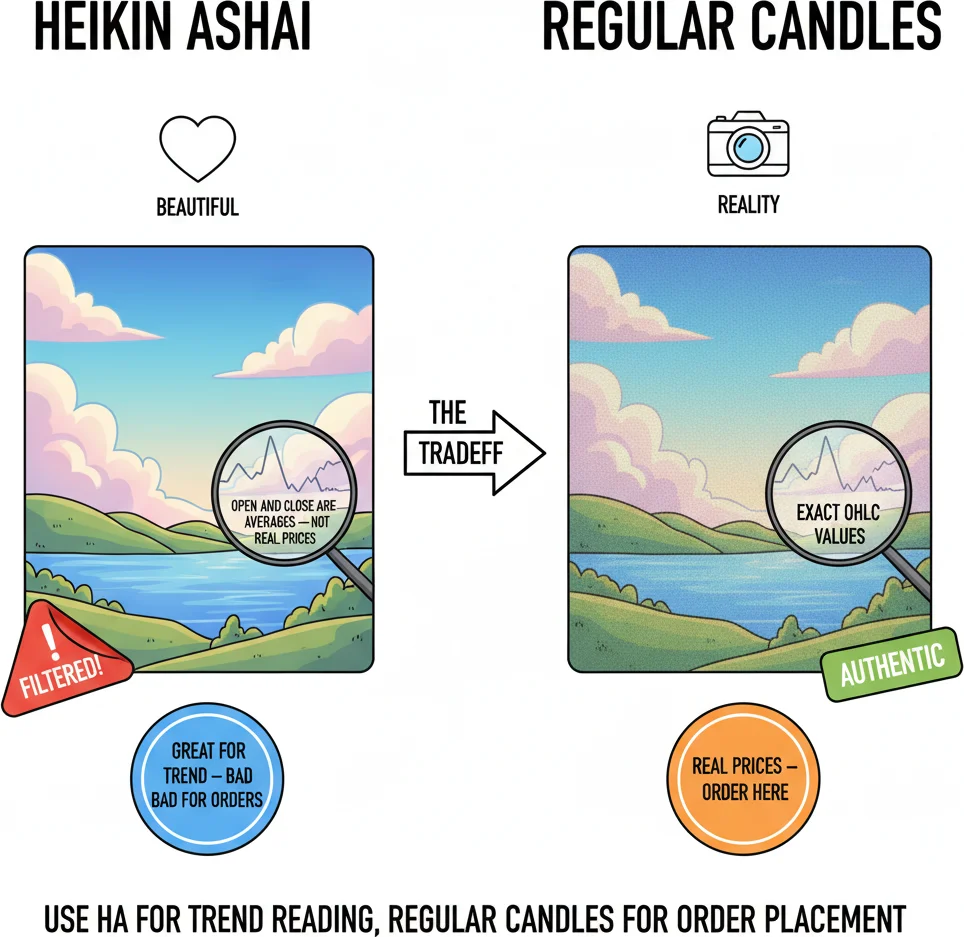
Heikin Ashi shows you the trend beautifully, but the open and close are NOT real prices. You cannot place orders on them.
Frequently Asked Questions
Q1Can you place orders based on Heikin Ashi candle prices?
No — HA candle values (Open, Close) are calculated averages, not actual market prices. An HA candle showing a close at 1.0920 might correspond to a real close of 1.0935. Always switch to a standard candlestick chart for placing stop-loss, take-profit, and entry orders. Use HA for directional analysis and standard charts for execution. This is the single most important practical rule for Heikin Ashi trading.
Q2What does a Heikin Ashi candle with no lower wick mean?
A green (bullish) HA candle with no lower wick indicates a strong uptrend — the HA Low equals either the HA Open or HA Close, meaning price never dipped below the bar's calculated range. A sequence of these candles signals sustained, one-directional buying pressure with no meaningful pullbacks. This is the HA equivalent of a strong momentum signal. The same logic in reverse applies to red candles with no upper wicks — strong downtrend.
Q3How do you identify a trend reversal on Heikin Ashi?
Watch for two sequential signals. First, the appearance of small-bodied candles with wicks on both sides (indecision bars) after a sustained trend run — this is the warning phase. Second, a change in candle color — green to red or red to green — confirms the reversal. Two consecutive opposing-color candles after indecision bars is the strongest reversal confirmation. Be aware that HA's smoothing creates 2-3 bars of lag, so the actual reversal on a standard chart may have already started before HA confirms it.
Q4Does Heikin Ashi have any adjustable parameters?
No. Unlike RSI (adjustable period), moving averages (adjustable length), or Bollinger Bands (adjustable multiplier), Heikin Ashi applies the same fixed formulas — HA Close = (O+H+L+C)/4, HA Open = average of prior HA Open and Close — regardless of instrument or timeframe. There is nothing to optimize or over-fit. This simplicity is a feature: you can't accidentally degrade the indicator through bad parameter choices.
Q5Which timeframe works best for Heikin Ashi?
H1 is the most balanced — the smoothing eliminates most M15 noise while remaining responsive enough to flag trend changes within hours. H4 is excellent for swing traders, where each indecision bar can precede 100+ pip reversals. M15 works for intraday trading during active sessions but lacks the smoothing depth to filter Asian-session noise effectively. Below M15, the averaging doesn't have enough price structure to filter meaningfully and the smoothing lag exceeds the value of the noise reduction.
Top Brokers
About the Author
Daniel Harrington
Senior Trading Analyst
Daniel Harrington is a Senior Trading Analyst with a MScF (Master of Science in Finance) specializing in quantitative asset and risk management. With over 12 years of experience in forex and derivatives markets, he covers MT5 platform optimization, algorithmic trading strategies, and practical insights for retail traders.
Use This Indicator
Risk Disclaimer
Trading financial instruments carries significant risk and may not be suitable for all investors. Past performance does not guarantee future results. This content is for educational purposes only and should not be considered investment advice. Always conduct your own research before trading.