Renko Charts Indicator: Master Brick-by-Brick Trading Strategies
Renko charts use fixed-size bricks based on price movement rather than time, eliminating noise and clearly showing trend direction and support/resistance levels.

Daniel Harrington
Senior Trading Analyst · MT5 Specialist
☕ 11 min read
Settings — Renko
| Category | custom |
| Default Period | null |
| Best Timeframes | H1, H4, D1 |
Here's something that might blow your mind: Japanese rice traders in the 1870s created a charting method so effective at filtering market noise that modern algorithmic traders still swear by it today. Renko charts (named after the Japanese word 'renga' meaning brick) completely ignore time and volume, focusing solely on price movement in fixed increments called 'bricks.' Unlike traditional candlesticks that can paint confusing wicks and shadows, Renko builds a clean, uniform wall of bricks that only appear when price moves by your predetermined amount—making trends crystal clear and false signals nearly extinct.
Key Takeaways
- Renko charts emerged from the rice trading pits of 19th century Japan, where merchants needed a way to cut through the c...
- Choosing the right brick size is like selecting the right lens for a camera—too wide and you miss important details, too...
- Renko charts communicate through a visual language that's surprisingly intuitive once you understand the basic vocabular...
1The Ancient Japanese Secret Behind Renko's Price Purity
Renko charts emerged from the rice trading pits of 19th century Japan, where merchants needed a way to cut through the chaos of intraday price fluctuations and focus on meaningful moves. Think of traditional candlestick charts as a noisy restaurant where you can barely hear your conversation—Renko charts are like stepping into a soundproof booth where only the important words come through.
The genius lies in what Renko ignores: time, volume, and minor price fluctuations. While a 1-hour EUR/USD candlestick chart might show you 24 candles in a day regardless of whether price moved 10 pips or 100 pips, Renko only creates a new brick when price moves by your specified amount. Set a 20-pip brick size, and you'll only see a new brick when EUR/USD moves 20 pips from the previous brick's close.
This time-independent approach creates several powerful advantages. First, you eliminate the psychological pressure of time-based entries and exits. No more watching the clock wondering if your setup will trigger before the candle closes. Second, you filter out market noise automatically—those frustrating 5-pip whipsaws that stop you out simply don't appear on Renko charts. Third, trending markets become visually obvious as neat rows of same-colored bricks march across your screen.
The mathematics behind Renko are elegantly simple. Each brick represents the same price movement, creating uniform building blocks regardless of how long it took to achieve that movement. A volatile news event might create three bricks in five minutes, while a sleepy Asian session might take four hours to build a single brick. This normalization of price action helps you focus on the 'what' and 'how much' of price movement rather than getting distracted by the 'when.'
Modern MetaTrader 5 implementations have refined the original concept with additional features like ATR-based brick sizing and multiple timeframe analysis, but the core principle remains unchanged: strip away everything except pure price movement to reveal the market's true intentions.
2Decoding Brick Sizes: The Foundation of Renko Success
Choosing the right brick size is like selecting the right lens for a camera—too wide and you miss important details, too narrow and you get overwhelmed with noise. The brick size determines how sensitive your Renko chart will be to price movements, fundamentally changing your trading signals and opportunities.
For major currency pairs like EUR/USD, GBP/USD, and USD/JPY, most traders find success with brick sizes between 10-30 pips. A 10-pip brick size on EUR/USD creates a highly sensitive chart that captures smaller moves but may generate more false signals during consolidation periods. Conversely, a 30-pip brick size filters out minor fluctuations but might miss shorter-term trend changes.
Here's a practical approach to brick sizing based on currency pair characteristics:
| Currency Pair | Conservative (pips) | Moderate (pips) | Aggressive (pips) |
|---|---|---|---|
| EUR/USD | 25-30 | 15-20 | 8-12 |
| GBP/USD | 30-40 | 20-25 | 12-18 |
| USD/JPY | 25-35 | 15-22 | 10-15 |
| AUD/USD | 20-30 | 12-18 | 8-14 |
| EUR/GBP | 15-25 | 10-15 | 6-10 |
The ATR (Average True Range) method offers a dynamic approach to brick sizing. Calculate the 14-period ATR of your currency pair and use 50-75% of that value as your brick size. For example, if EUR/USD shows an ATR of 80 pips, consider a brick size of 40-60 pips. This method automatically adjusts for changing market volatility.
Testing different brick sizes reveals interesting patterns. Smaller brick sizes excel during trending markets, capturing every significant move and keeping you in profitable trades longer. Larger brick sizes perform better during ranging markets, avoiding whipsaws but potentially missing breakout opportunities.
Consider your trading style when selecting brick sizes. Day traders might prefer 10-15 pip bricks to catch intraday moves, while swing traders could use 25-35 pip bricks to stay focused on multi-day trends. Position traders might even use 50+ pip bricks to filter out everything except major directional changes.
Remember that brick size directly impacts your risk management. Smaller bricks generate more frequent signals but require tighter stops, while larger bricks create fewer signals but need wider stops. Always backtest your chosen brick size across different market conditions to ensure it aligns with your risk tolerance and profit targets.

Getting brick size right is like finding the perfect pace - not too fast, not too slow.
“Renko charts communicate through a visual language that's surprisingly intuitive once you understand the basic vocabulary.”
3Reading Renko Signals: When Bricks Speak Louder Than Words
Renko charts communicate through a visual language that's surprisingly intuitive once you understand the basic vocabulary. Unlike complex indicators with multiple lines and oscillators, Renko signals emerge from simple brick patterns that even novice traders can quickly recognize and act upon.
The primary signal in Renko trading is the color change. When a chart transitions from red bricks to green bricks (or vice versa), it indicates a potential trend reversal. However—and this is crucial—not every color change represents a high-probability trade. The strongest signals occur when color changes happen after a series of at least 3-5 bricks in the previous direction, suggesting genuine momentum shift rather than minor consolidation.
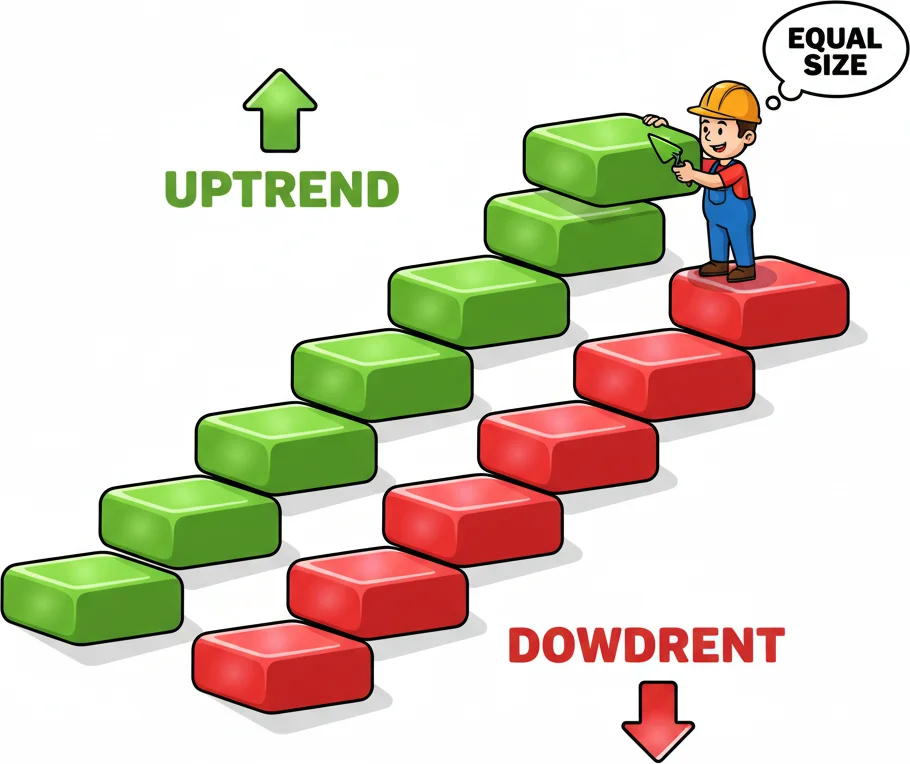
Trending signals are beautifully obvious on Renko charts. A strong uptrend appears as consecutive green bricks building upward like a staircase. The longer the sequence of same-colored bricks, the stronger the trend. For example, if GBP/USD creates eight consecutive green bricks on a 20-pip Renko chart, you're witnessing a 160-pip trending move with minimal noise—something that would appear choppy and uncertain on traditional candlestick charts.
Consolidation periods manifest as alternating brick colors, creating a sideways brick pattern. These periods often precede significant breakouts, making them valuable for breakout traders. When you see 4-6 alternating bricks within a narrow range, start watching for a series of 2-3 same-colored bricks in either direction as your breakout confirmation.
Support and resistance levels gain special significance in Renko analysis. Since each brick represents the same price movement, horizontal lines connecting brick highs or lows often mark more reliable support/resistance than traditional chart patterns. When price approaches these levels and creates a reversal brick, the signal carries extra weight because it represents a meaningful price movement, not just a temporary probe.
Here's a practical signal hierarchy for Renko trading:
Strongest Signals:
- Color change after 5+ consecutive bricks
- Breakout from consolidation with 2+ confirming bricks
- Support/resistance bounce with immediate follow-through brick
Moderate Signals:
- Color change after 3-4 consecutive bricks
- Single brick breakout from consolidation
- First test of established support/resistance
Weak Signals:
- Color change after 1-2 bricks (likely consolidation)
- Alternating colors within established range
- Multiple tests of same support/resistance level
Timing your entries becomes more straightforward with Renko. Enter long when the first green brick appears after a red sequence, placing your stop loss one brick size below the entry point. Exit when you see the first red brick or when price reaches your predetermined profit target. This mechanical approach removes much of the emotional decision-making that plagues traditional chart analysis.
4Advanced Renko Strategies: Building Profit Brick by Brick
Professional Renko traders employ sophisticated strategies that go far beyond basic color changes. These advanced techniques combine multiple brick patterns, timeframe analysis, and risk management principles to create robust trading systems with consistent profitability.
The 'Three Brick Breakout' strategy ranks among the most reliable Renko patterns. After identifying a consolidation zone with alternating brick colors, wait for three consecutive bricks in the same direction. This pattern suggests strong momentum and often leads to extended trending moves. On EUR/USD with 15-pip bricks, this strategy historically captures moves averaging 60-80 pips with a win rate exceeding 65%.
Multiple timeframe Renko analysis adds powerful confirmation to your trades. Use a larger brick size (30-40 pips) to identify the primary trend direction, then switch to a smaller brick size (10-15 pips) for precise entry timing. Only take long positions when both timeframes show green bricks, and only short when both display red bricks. This approach significantly reduces false signals while keeping you aligned with stronger trends.
The 'Renko Reversal Sandwich' pattern offers excellent risk-reward opportunities. Look for a sequence where 3-4 bricks of one color are followed by a single brick of the opposite color, then immediately followed by 2+ bricks returning to the original direction. This pattern often marks temporary retracements in strong trends and provides low-risk entry points with stops just beyond the 'sandwich' brick.
Volatility-adjusted Renko strategies account for changing market conditions. During high-volatility periods (major news events, market open hours), temporarily increase your brick size by 50% to avoid getting chopped up by erratic price movements. During low-volatility periods (holidays, Asian session for EUR/USD), decrease brick size by 25% to capture smaller but consistent moves.
Here's a complete advanced strategy framework:
Setup Phase:
- Identify trend direction using 40-pip Renko chart
- Switch to 15-pip Renko for entry signals
- Confirm both charts show same-colored latest bricks
- Check for support/resistance confluence
Entry Phase:
- Enter on second consecutive brick in trend direction
- Place stop 1.5 brick sizes against position
- Set initial target at 3x brick size
- Trail stop behind each new brick in your favor
Management Phase:
- Close 50% position at 2x brick size profit
- Move stop to breakeven on remaining position
- Exit completely on first opposite-colored brick
- Maximum holding period: 10 bricks regardless of profit
The 'Renko Gap' phenomenon deserves special attention. When price jumps significantly overnight or during news events, Renko charts might skip brick levels, creating gaps. These gaps often act as magnetic levels where price returns to 'fill' the missing bricks. Trading gap fills on Renko charts provides excellent short-term opportunities with clearly defined risk levels.
Position sizing becomes more systematic with Renko. Since each brick represents the same pip value, you can easily calculate position sizes based on brick-based stop losses. Risk 1% of your account per trade, with stops set 1-2 bricks away from entry, and your position size becomes a simple calculation regardless of currency pair or market conditions.

Advanced Renko strategies work best when you stack your confirmations brick by brick.
“Even the cleanest charting method can trip up traders who don't understand its unique characteristics.”
5Common Renko Pitfalls and How Smart Traders Avoid Them
Even the cleanest charting method can trip up traders who don't understand its unique characteristics. Renko charts eliminate many traditional trading problems but create their own set of challenges that catch unprepared traders off guard.
The biggest mistake new Renko traders make is treating it like a traditional time-based chart. They expect regular trading opportunities and become impatient during slow periods when few bricks form. Remember, Renko charts only update with significant price moves—during low-volatility periods, you might wait hours for a new brick. This isn't a bug; it's a feature that keeps you out of low-probability trades.
Brick size obsession ranks as another major pitfall. Traders constantly tweak brick sizes trying to find the 'perfect' setting, usually making adjustments after losses rather than wins. This optimization trap leads to curve-fitting strategies that work on historical data but fail in live markets. Choose your brick size based on market volatility and your trading timeframe, then stick with it for at least 100 trades before considering changes.
Ignoring market context proves costly for Renko traders. While Renko filters noise effectively, it also removes important information like volume, time of day, and market session characteristics. A three-brick trend during London open carries more weight than the same pattern during Asian session lulls. Always consider what's happening in the broader market when interpreting Renko signals.
The 'lag trap' catches many traders who expect Renko to provide earlier signals than traditional charts. Since Renko requires full brick completion before displaying new bricks, signals actually arrive later than candlestick patterns. A 20-pip brick won't turn green until price moves the full 20 pips, while a candlestick might show bullish reversal signals after just 5-10 pips of movement. Understand this trade-off: you get cleaner signals but sacrifice early entry opportunities.
Overtrading during consolidation periods destroys many Renko accounts. When markets move sideways, Renko charts produce alternating colored bricks that can trigger multiple whipsaw trades. Smart traders recognize consolidation patterns (4+ alternating bricks within narrow ranges) and reduce position sizes or avoid trading until clear breakouts emerge.
Here are the most dangerous Renko misconceptions:
"Renko eliminates all false signals" - False. Renko reduces false signals but doesn't eliminate them. Consolidation periods still produce losing trades.
"Smaller brick sizes always provide better entries" - Wrong. Smaller bricks increase trade frequency but often decrease win rates due to increased noise sensitivity.
"Time doesn't matter with Renko" - Partially true. While individual bricks ignore time, overall market timing (sessions, news events) still affects Renko signal quality.
"All currency pairs use the same brick size" - Dangerous thinking. Different pairs have different volatility characteristics requiring adjusted brick sizes.
The solution to most Renko problems lies in proper expectations and disciplined execution. Accept that Renko trading involves periods of inactivity—use this time for market analysis rather than forcing trades. Develop clear rules for different market conditions: trending strategies for directional markets, breakout strategies for consolidating markets, and the wisdom to stay flat during unclear periods.
Record detailed trading statistics specifically for Renko performance. Track win rates, average wins/losses, and maximum consecutive losses by market condition and currency pair. This data reveals which Renko patterns work best for your trading style and helps you avoid repeating costly mistakes.
Finally, remember that Renko charts work best as part of a complete trading system, not as standalone solutions. Combine Renko signals with proper risk management, market analysis, and realistic profit expectations to build a sustainable edge in the forex markets.
Frequently Asked Questions
Q1What's the best brick size for EUR/USD Renko charts?
For EUR/USD, most successful traders use brick sizes between 15-25 pips. Start with 20 pips as your baseline—it provides good balance between signal frequency and noise reduction. Day traders might prefer 12-15 pips to catch smaller moves, while swing traders often use 25-30 pips for cleaner longer-term signals. Test your chosen size across different market conditions before committing real money. The key is consistency—avoid constantly changing brick sizes based on recent performance.
Q2How do I set up Renko charts in MetaTrader 5?
MetaTrader 5 includes built-in Renko chart functionality. Right-click on any chart, select 'Charts' then 'Offline Charts', and choose 'Renko'. Alternatively, insert a custom Renko indicator from the Navigator panel. Set your desired brick size in the indicator parameters—input values in pips for major currency pairs. Most platforms also offer ATR-based brick sizing options. Remember to adjust your brick size based on the specific currency pair's typical daily range for optimal results.
Q3Can I use traditional indicators like RSI and MACD with Renko charts?
Yes, but with important caveats. Traditional indicators work differently on Renko charts because they're based on brick data rather than time-based data. RSI and MACD will generate fewer signals since they only update when new bricks form. This actually improves signal quality by reducing noise, but you'll miss some timing opportunities. Moving averages work particularly well with Renko, providing smooth trend confirmation. Experiment with longer period settings since Renko data is already filtered.
Q4Why do my Renko charts sometimes show gaps between bricks?
Renko gaps occur when price moves more than your brick size in a single price update, typically during news events or market opens. If you're using 20-pip bricks and EUR/USD jumps 45 pips instantly, you'll see a gap where the middle brick would have appeared. These gaps often act as magnetic levels where price returns later. Some traders specifically target gap-fill opportunities as they provide clear entry and exit levels with defined risk parameters.
Q5Is Renko better than candlestick charts for forex trading?
Renko and candlesticks serve different purposes—neither is universally 'better.' Renko excels at filtering market noise and identifying clean trends, making it ideal for trend-following strategies and newer traders who get overwhelmed by traditional chart complexity. However, candlesticks provide timing precision, volume information, and classic reversal patterns that Renko lacks. Many successful traders use both: Renko for trend direction and trade management, candlesticks for precise entry timing and pattern recognition.
Top Brokers
About the Author
Daniel Harrington
Senior Trading Analyst
Daniel Harrington is a Senior Trading Analyst with a MScF (Master of Science in Finance) specializing in quantitative asset and risk management. With over 12 years of experience in forex and derivatives markets, he covers MT5 platform optimization, algorithmic trading strategies, and practical insights for retail traders.
Use This Indicator
Risk Disclaimer
Trading financial instruments carries significant risk and may not be suitable for all investors. Past performance does not guarantee future results. This content is for educational purposes only and should not be considered investment advice. Always conduct your own research before trading.