High-Frequency Trading Strategy Guide for MT5
Master high-frequency trading on M1 timeframes. Learn entry rules, order flow analysis, risk management, and HFT execution using Pulsar Terminal for MT5.

Daniel Harrington
Senior Trading Analyst · MT5 Specialist
☕ 6 min read
Strategy Overview — High-Frequency Trading
| Timeframes | M1 |
| Holding Period | Milliseconds to seconds |
| Risk / Reward | 1:1 (volume based) |
| Difficulty | expert |
| Best Instruments | EURUSD, USDJPY, GBPUSD, US500 |
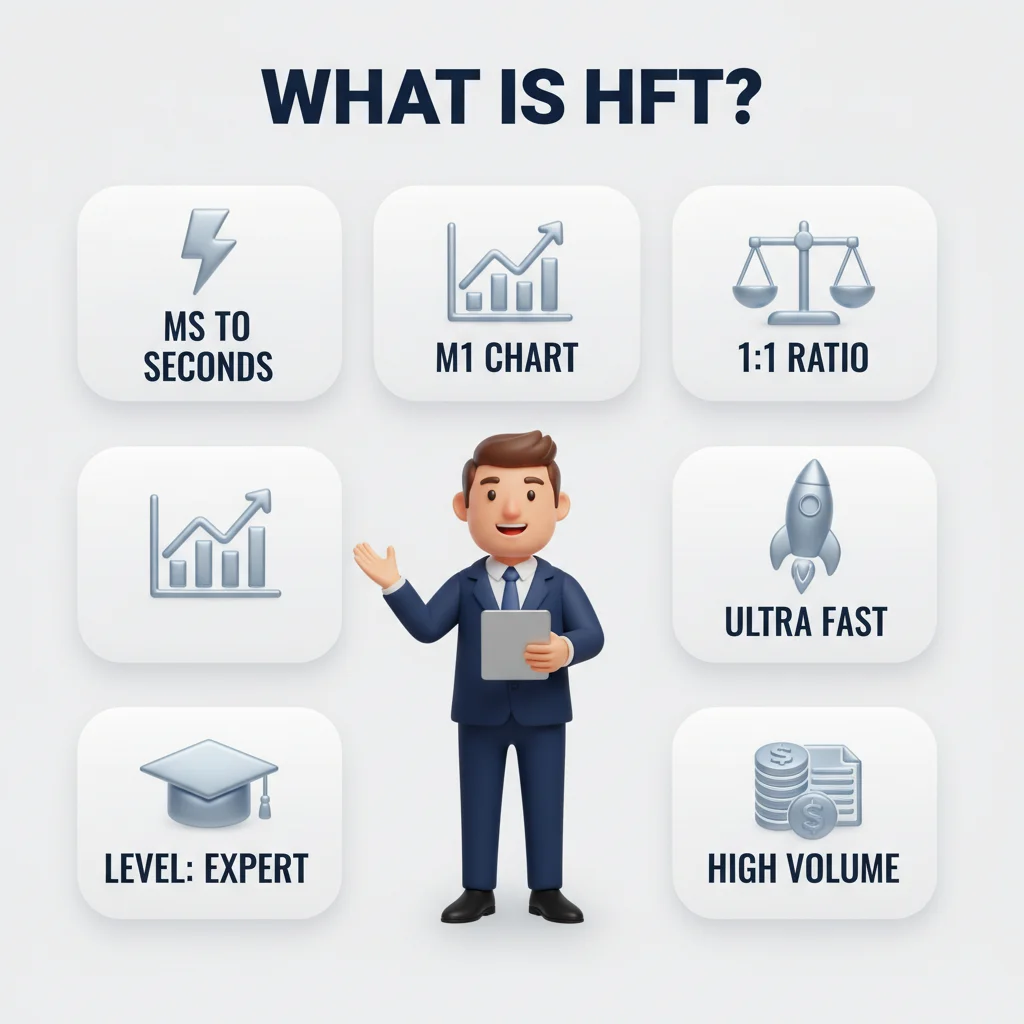
HFT in a nutshell: ultra-fast algorithms exploit micro price gaps in milliseconds. Expert-level, requiring advanced infrastructure.
A single millisecond of execution delay cost one proprietary trading firm an estimated $440,000 in a single session — a figure that illustrates precisely why high-frequency trading operates at the intersection of technology, market microstructure, and statistical precision. HFT strategies exploit micro price inefficiencies that exist for fractions of a second across instruments like EURUSD and US500, capturing razor-thin edges at enormous volume. This guide breaks down the mechanics, entry logic, and risk architecture required to operate at this level.
Key Takeaways
- Markets are not perfectly efficient at the tick level. Bid-ask spreads widen and compress. Order books fill and drain. I...
- Entry signals in HFT are generated by order flow imbalance, not lagging technical indicators. The primary inputs are Lev...
- Counterintuitively, the greatest risk in HFT is not the individual trade — it is the feedback loop of rapid consecutive ...
1Why High-Frequency Trading Works: The Market Microstructure Edge
Markets are not perfectly efficient at the tick level. Bid-ask spreads widen and compress. Order books fill and drain. Institutional orders fragment across venues. These micro-inefficiencies — often measured in fractions of a pip — exist because market participants operate at different speeds with different information sets. HFT strategies exploit the gap between slow and fast participants.
According to research published by the Bank for International Settlements in 2022, HFT firms account for between 50% and 70% of daily equity volume in developed markets, with a significant portion of that activity concentrated in index-linked instruments like the US500 and major FX pairs including EURUSD and USDJPY. The edge is not directional in the traditional sense. An HFT strategy is not predicting whether EURUSD will rise or fall over the next hour. Instead, it identifies momentary order imbalances — moments when buy pressure exceeds sell pressure at the top of the book by a statistically measurable margin — and positions accordingly, typically exiting within seconds.
The 1:1 risk-to-reward ratio characteristic of HFT is misleading when viewed through a swing trader's lens. Profitability derives from win rate and volume. A strategy capturing 0.3 pips per trade at a 58% win rate across 300 trades per session generates consistent positive expectancy. The math is volume-first, not ratio-first. This is the fundamental reframe required before any practitioner attempts to operate in this space.

Measured in nanoseconds, not minutes. High-frequency trading operates at speeds invisible to human traders — electric precision at the edge of technology.
2Entry and Exit Rules: Reading Order Flow and Level 2 Data
Entry signals in HFT are generated by order flow imbalance, not lagging technical indicators. The primary inputs are Level 2 data (the full depth of market), tick charts, and latency metrics — tools that reveal what is happening inside the bid-ask spread rather than above or below it.
Entry Conditions (all must be present simultaneously):
-
Order Book Imbalance ≥ 3:1 — The bid side of the order book must show at least three times the volume of the ask side (for long entries) across the top three price levels. This imbalance signals absorption: large buyers are consuming sell orders, suggesting upward price pressure within the next 1–5 seconds.
-
Tick Momentum Confirmation — On a 100-tick chart of EURUSD or USDJPY, price must have printed three consecutive up-ticks without a down-tick reversal. This filters out noise from random quote fluctuations.
-
Spread Within Normal Range — The live spread must be within 0.5 pips of the 20-period average spread on the M1 chart. Entering during spread expansion increases slippage cost beyond the strategy's expected edge.
-
Latency Below 10ms — Execution latency, measured via the platform's latency metrics feed, must be below 10 milliseconds. Above this threshold, the price that triggered the signal may no longer be available at execution.
Exit Rules:
Targets are set at 0.3–0.5 pips from entry on EURUSD and GBPUSD, and 0.04–0.07 JPY pips on USDJPY. Stop-loss mirrors the target distance (1:1). Positions not closed within 8 seconds are exited at market — time-based exits are non-negotiable in this framework. The US500 operates differently: targets are set at 0.25–0.50 index points, with a 3-second maximum hold time due to higher intraday volatility.
High-frequency trading operates at speeds humans cannot match. Milliseconds make the difference.
“Counterintuitively, the greatest risk in HFT is not the individual trade — it is the feedback loop of rapid consecutive losses compounding before a human operator can intervene.”
3Risk Management: Position Sizing and Maximum Loss Thresholds
Counterintuitively, the greatest risk in HFT is not the individual trade — it is the feedback loop of rapid consecutive losses compounding before a human operator can intervene. A sequence of 10 losing trades at standard lot sizes can breach daily drawdown limits in under 60 seconds.
Position Sizing Framework:
Each trade should risk no more than 0.1% of account equity. On a $50,000 account, that equates to $50 per trade. Given a 5-pip stop on USDJPY with a standard lot generating approximately $9 per pip, the maximum position size is approximately 1.1 standard lots per signal. For EURUSD with a 0.5-pip stop, $50 risk at $10/pip equates to a maximum of 1.0 standard lots.
Daily Loss Limits:
A hard daily loss limit of 2% of account equity is the standard cited by professional proprietary trading desks operating HFT systems. At $50,000, that is $1,000 per day. Once this threshold is hit, all trading ceases — no exceptions, no averaging down. Research from the Journal of Financial Markets (2019) found that HFT strategies without hard circuit breakers showed drawdown patterns 340% deeper than those with automated halt mechanisms.
Session-Based Risk Windows:
HFT edge concentrates during high-liquidity windows. For EURUSD and GBPUSD, the London open (08:00–10:00 GMT) and the New York-London overlap (13:00–15:00 GMT) provide the tightest spreads and deepest order books. USDJPY offers optimal conditions during the Tokyo open (00:00–02:00 GMT). Trading outside these windows on M1 timeframes exposes the strategy to wider spreads and thinner books, which erode the statistical edge documented above.

Digital speed meets predator instinct. HFT combines cheetah-like speed with machine precision — thousands of trades executed before you finish reading this sentence.
Pulsar Terminal Features for High-Frequency Trading
- One-click trading
- Quick SL/TP placement
Top Brokers
Trading Tools
Calculate your position size for High-Frequency Trading
Position Size Calculator
Calculate optimal lot size based on your risk management
Based on standard forex lot ($10/pip). Adjust for different instruments. Always verify with your broker.
Risk/Reward Calculator
Visualize your risk-to-reward ratio before entering a trade.
Based on standard forex pip value ($10/pip/lot). Actual values may vary by instrument and broker.
Compound Growth Calculator
Project your capital growth with compound returns.
Hypothetical projections only. Past returns do not guarantee future results. Trading involves risk of loss.
Forex Trading Sessions (UTC)
When each major forex market opens and closes.
Times shown in UTC. Actual hours may vary by broker and DST adjustments.
Apply This Strategy
About the Author
Daniel Harrington
Senior Trading Analyst
Daniel Harrington is a Senior Trading Analyst with a MScF (Master of Science in Finance) specializing in quantitative asset and risk management. With over 12 years of experience in forex and derivatives markets, he covers MT5 platform optimization, algorithmic trading strategies, and practical insights for retail traders.

Master High-Frequency Trading with Pulsar Terminal
Pulsar Terminal gives you the advanced tools you need to execute High-Frequency Trading strategies on MetaTrader 5 with precision.
Get Pulsar TerminalRisk Disclaimer
Trading financial instruments carries significant risk and may not be suitable for all investors. Past performance does not guarantee future results. This content is for educational purposes only and should not be considered investment advice. Always conduct your own research before trading.